
Weekly Perspective: For Whom the Bell Tolls

Forty years and 4,562%. That is how long and how far the bull market in bonds has charged, until now. The Bloomberg Barclay’s Treasury Total Return Index has just sustained its first 20% drawdown, what is often considered the threshold of a “bear market”, during its spectacular 40-year run (see Chart 1).
Before we start ringing the skillet bell on the bond bull market, let’s take a look at this sell-off in bonds to see if it is, in fact, an end of an era, or if the long-term trend of lower yields remains intact.
Chart 1: Bloomberg Barclay’s Treasury Total Return Index with Maximum Drawdown (bottom panel)
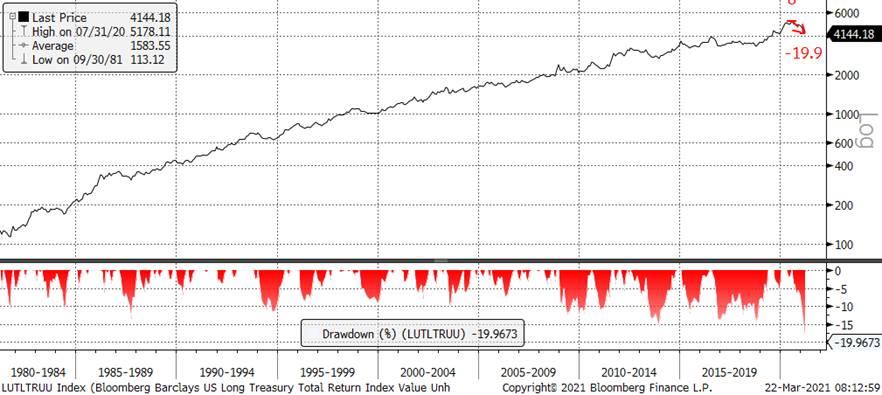
Source: Bloomberg, Fieldpoint Private
The degree of the recent rebound in yields (sell-off in price) is so large because the starting point for yields was so low. Chart 2 shows how unprecedented the collapse in yields was in the early days of the pandemic. Chart 3 shows how rapid this move higher in yields has been: this has been the largest six-month change in 10-year yields in the past 60 years. Note the increasing magnitude of these moves over the past ten years. Is this a function of massive central bank intervention since the GFC and similar to the increasing intensity of boom/bust cycles we observe in other asset classes?
Chart 2: U.S. Treasury 10-Year Yield (60 year, weekly, log scale)
Note the magnitude of the collapse in 2020
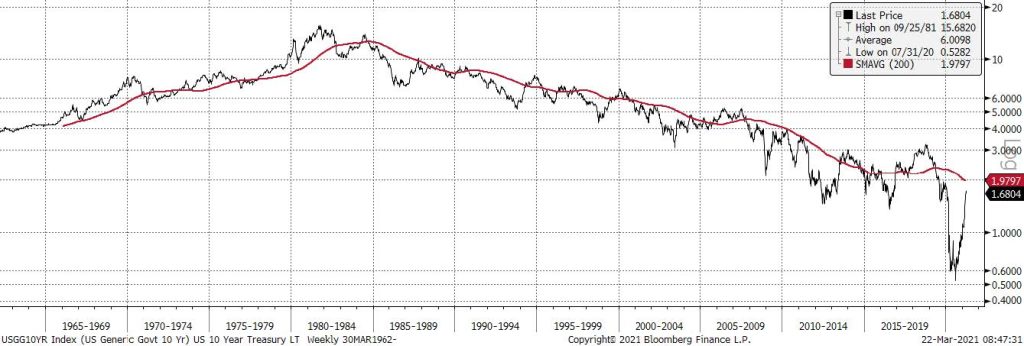
Source: Bloomberg, Fieldpoint Private
Chart 3: 6-Month Change in U.S. Treasury 10-Year Yield
The largest 6-month move in 60 years note the increasing magnitude over the last 10 years
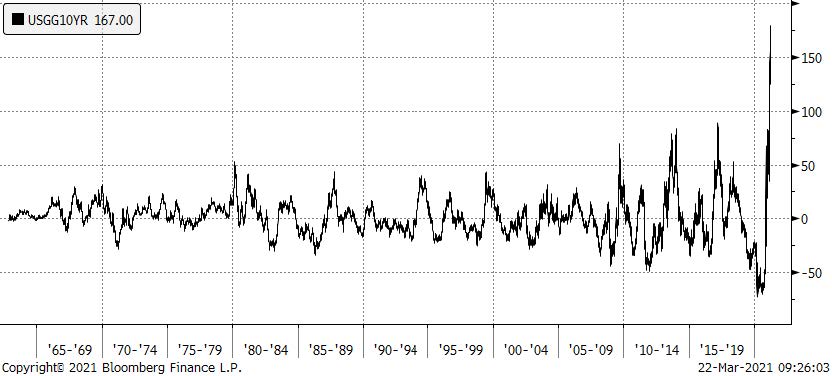
Source: Bloomberg, Fieldpoint Private
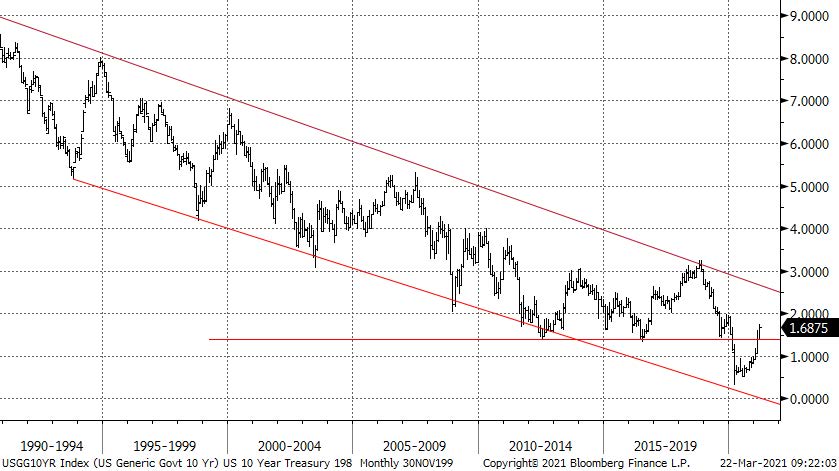
Hitting an all-time low of 0.51% on August 4, 2020, a 75% drop over the prior six months, created plenty of room for upside to yields, while still remaining in the long-term downtrend. Chart 4 shows how the recent move higher in yields only brings us back to the territory of prior all-time lows (2012 and 2016), with still room for upside while retaining the long-term downtrend in yields that have characterized the 40-year bull market in bonds.
It is interesting to note in this chart that the inflationary period of value-led, pro-cyclical, non-US dominant, commodity boom markets of 2003-2007 happened with a tailwind of higher rates that still remained within the confines of this long term downtrend in yields.
Chart 4: U.S. Treasury 10-Year Yield (30 Year, monthly)
Despite the sharp move higher, yields are still only near the 2012/2016 lows; plenty of room for yields to move higher and remain in a long term downtrend
Outside of price action, what about fundamental factors that could drive a shift in the long-term return potential for bonds? We have written about the policy regime change (see article here), where the combination of aggressive, deficit-fueled fiscal spending plus inflation-tolerant monetary policy has the potential to cause a shift in leadership away from assets that thrived in the prior regime (which was characterized by low reliance on fiscal spending and a Fed inclined to tighten at the first early sign of inflation).
The key question for long bonds continues to be about inflation, as higher inflation would make the relatively low yields on long bonds increasingly unattractive. But there remains a vigorous debate about just how inflationary this policy shift will be (see our article here, plus this video of Bloomberg’s Wall Street Week starting at minute 24 that includes interviews on both sides of the debate with Paul Krugman and Larry Summers). To see a true end to the long-term bull market in bonds, we would likely need to see a sustained period of higher, possibly runaway inflation that is either shrugged off by the Fed or impervious to the Fed’s efforts to eventually control it.
It is likely too early to make this call. We know inflation will be high in the coming months due to base effects (easy comparisons from 2020), the stimulus being released on the reopening economy, and tight/disrupted supply chains. It is possible that these inflation impacts last somewhat longer than the inflation-doubters expect say into 2022, mainly due to supply chain constraints. This could be the cause of further upward pressure on yields in the near term. However, this doesn’t automatically mean that we find ourselves in an entrenched inflationary environment similar to the late 1960s through the early 1980s. As Steve Ricchiuto clearly lays out in his accessible and enlightening Disequilibrium, the conditions that eventually broke the Great Inflation are still present today (globalization, demographics, technology, lower regulation, lower labor bargaining power, etc.). Thus, here is the key question: will the shift to a more inflationary policy regime be enough to overwhelm these more stable disinflationary economic drivers?
So, similar to price action, we find ourselves witnessing an extraordinary change while remaining at an ambiguous juncture. It is too early to call the end of the long downtrend in bond yields from both a technical and fundamental perspective, while it is likely also too early to call an end to the current volatility we are experiencing in bond yields. The reality is that the U.S. economy is about to experience its fastest GDP growth in almost 40 years (the Fed raised its 2021 growth estimate to 6.5%), with an unemployment rate expected to move back close to a 50 year low by the end of the year, fueled by an unprecedented amount of fiscal and monetary policy support, all the while long bond yields, even after the recent move higher, are still very low from a historical perspective. Further rationalization of yields and growth/inflation/employment levels can be expected.
And here we find ourselves, quite like Robert Jordan at the end of the Hemingway novel asserting: “There’s no one thing that’s true. It’s all true.”
Last Week in Markets: Choppy Equities Still End At Records; Long Yields Higher While ECB Promises to Step Up Buying
Equities
U.S. large-cap equity indices ended the week lower (S&P 500 -0.77%, NASDAQ -0.79%, Dow Jones Industrial -0.46%). After a particularly strong prior week, small caps underperformed last week (Russell 2000 -2.77%). Growth and Value were both down and by similar amounts (Growth -0.88%, Value -0.83%).
From a sector perspective, as seen in Table 1 below, defensive sectors (Staples, Health Care and Utilities) were amongst the best performers. After a strong start to the week, enjoying the steepening of the yield curve, Financials came under pressure on Friday after the Fed announced it would not be extending the yearlong easing of capital requirements for large banks (see WSJ here). Though there was some continued volatility in the Treasury market on Friday, large Treasury market disruption is not expected given a more permanent solution to capital relief is likely given the continued surge in both Treasury issuance and deposits (see WSJ article here). Energy shares also came under pressure due to the drop in oil prices, which analysts attributed to a combination of higher U.S. oil inventories and the faltering recovery in Europe given renewed lockdowns. See the commodity section below for a further discussion about oil prices.
Table 1: S&P 500 Sector Performance
| Index Name | 1 Week | YTD |
| Consumer Discretionary | -0.1% | 2.0% |
| Consumer Staples | 0.5% | -2.7% |
| Communication Services | 0.2% | 8.5% |
| Energy | -7.7% | 29.3% |
| Financials | -1.7% | 15.5% |
| Health Care | 0.4% | 1.0% |
| Industrials | -0.3% | 8.6% |
| Materials | -0.8% | 7.2% |
| Tech | -1.4% | -0.8% |
| Utilities | -0.3% | -1.6% |
| Real Estates | -1.0% | 5.2% |
| S&P 500 | -0.8% | 4.2% |
Source: Bloomberg, Fieldpoint Private, as of 3/12/21
Currencies and Commodities
As mentioned earlier, oil prices came under pressure last week (WTI -6.73% to $60.99, Brent -6.91% to $64.12). Analysts ascribed the weakness to a report of an increase in U.S. oil inventories, worries about the demand recovery in Europe due to renewed lockdowns, and rationalizations that oil prices had likely moved too far too fast. Adding to this, the International Energy Agency released its Oil Market Report, where it threw cold water on the notion that oil has entered into a new super-cycle and there is an impending supply shortfall (see IEA report here). The IEA argues that there remains a substantial inventory overhang and significant spare production capacity that will serve to limit oil’s ability to sustain significant price increases (see Bloomberg article here for further perspective: “But you don’t hold that much spare capacity when things are going great; this is not the stuff of supercycles”;). In the U.S., O&G producers are striking a balance between growing production to capitalize on higher prices and keeping shareholders happy by fixing balance sheets and “living” within their cash flows (this FT article).
Chart 5: U.S. Crude Production is Expected to Rise Again
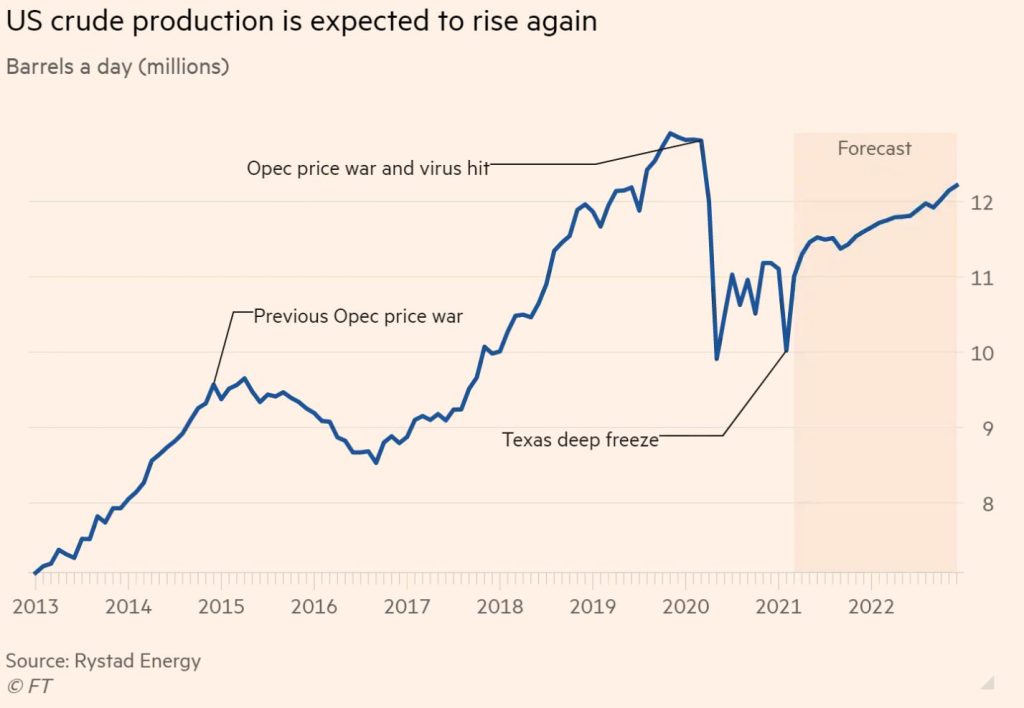
Source: Bloomberg, Fieldpoint Private
Disclosures
IMPORTANT LEGAL INFORMATION
This material is for informational purposes only and is not intended to be an offer or solicitation to purchase or sell any security or to employ a specific investment strategy. It is intended solely for the information of those to whom it is distributed by Fieldpoint Private. No part of this material may be reproduced or retransmitted in any manner without prior written permission of Fieldpoint Private. Fieldpoint Private does not represent, warrant or guarantee that this material is accurate, complete or suitable for any purpose and it should not be used as the sole basis for investment decisions. The information used in preparing these materials may have been obtained from public sources. Fieldpoint Private assumes no responsibility for independent verification of such information and has relied on such information being complete and accurate in all material respects. Fieldpoint Private assumes no obligation to update or otherwise revise these materials. This material does not contain all of the information that a prospective investor may wish to consider and is not to be relied upon or used in substitution for the exercise of independent judgment. To the extent such information includes estimates and forecasts of future financial performance it may have been obtained from public or third-party sources. We have assumed that such estimates and forecasts have been reasonably prepared on bases reflecting the best currently available estimates and judgments of such sources or represent reasonable estimates. Any pricing or valuation of securities or other assets contained in this material is as of the date provided, as prices fluctuate on a daily basis. Past performance is not a guarantee of future results. Fieldpoint Private does not provide legal or tax advice. Nothing contained herein should be construed as tax, accounting or legal advice. Prior to investing you should consult your accounting, tax, and legal advisors to understand the implications of such an investment.
Fieldpoint Private Securities, LLC is a wholly-owned subsidiary of Fieldpoint Private Bank & Trust (the “Bank”). Wealth management, securities brokerage and investment advisory services offered by Fieldpoint Private Securities, LLC and/or any non-deposit investment products that ultimately may be acquired as a result of the Bank’s investment advisory services:
Such services are not deposits or other obligations of the Bank:

− Are not insured or guaranteed by the FDIC, any agency of the US or the Bank
− Are not a condition to the provision or term of any banking service or activity
− May be purchased from any agent or company and the member’s choice will not affect current or future credit decisions, and
− Involve investment risk, including possible loss of principal or loss of value.
© 2021 Fieldpoint Private
Banking Services: Fieldpoint Private Bank & Trust. Member FDIC.
Registered Investment Advisor: Fieldpoint Private Securities, LLC is an SEC Registered Investment Advisor and Broker Dealer. Member FINRA, MSRB and SIPC.
Johnny Gibson
CFA®, Chief Investment Officer
Cameron Dawson
CFA®,
Chief Market
Strategist