
Weekly Perspectives: Earnings High Jumps; Seasons Don’t Fear the Taper

Earnings High Jumps
Last week brought us the initial batch of earnings reports from U.S. companies. Many of the companies that reported last week delivered results that “beat” on headline numbers, but the stocks sold off sharply. It is far too early to make a call about the tenor of the rest of this earnings season, as we shouldn’t extrapolate from this small sample of results, but we are reminded to pay close attention to share price reactions in the face of earnings beats or misses.
As a quick background, the earnings estimates that you see reported as “consensus” are averages of sell-side research analysts who do not actually have positions in the stocks (in general). Buy-side investors (mutual funds, hedge funds, etc.) are the ones that are actually buying/selling/holding the stock. Analysts are different than investors.
Of course, the sell-side can influence the price of stocks through estimate changes and upgrades/downgrades, but their estimates and ratings are not a direct reflection of actual investor positioning in and sentiment towards a stock. This is an important distinction to make when we consider reactions to earnings beats an misses. This distinction is how we get to scenarios where company earnings can miss estimates by a huge margin, but the stock goes up, or where company earnings can beat estimates by a huge margin, but the stock goes down. The reaction of the stock to beats and misses tells you where actual investor sentiment and positioning lies.
If a company beats sell-side analyst estimates but the stock sells off, it could be an indicator of a few things: it was a “low quality” beat (true underlying earnings were weaker), that buy-side investor expectations were above the sell-side (investors had a higher bar), that positioning was already very long/overweight the stock (meaning you needed a bigger beat/better outlook to spur the incremental buyer), or that investors sensed that the pace of beats/growth will slow in the future (you may have heard of the “2nd derivative” trades, as a stock can come under pressure if the pace of growth slows even if the absolute growth rate is still healthy). The inverse of all of this can happen with positive share price reactions to misses.
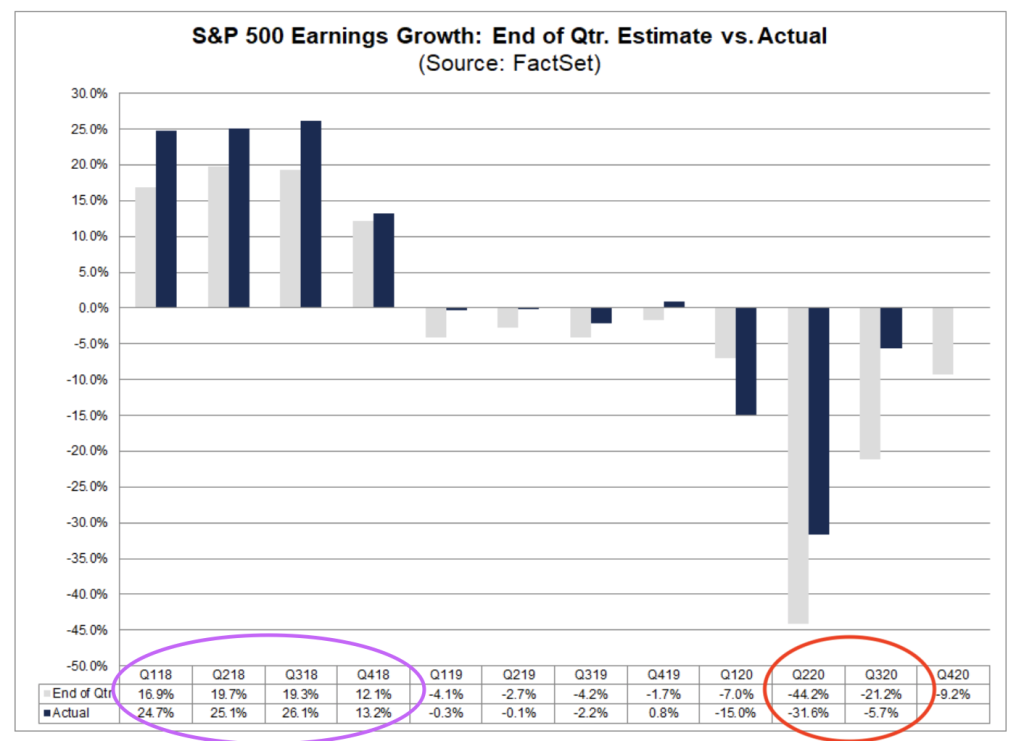
Divergences in share price reactions from beats/misses can be important indicators for the future direction of the market. In early 2016, it was very positive reactions to big earnings misses by cyclical companies that indicated that a cyclical and broad stock market rally was taking hold: investors were too underweight/bearish on cyclicals, and the earnings declines were getting “less bad”. The stocks rose as investors recalibrated to more optimistic positioning. In 2018, it was the opposite, with many cyclical stocks selling off sharply during the 1Q18 earnings season, despite strong beats to analyst estimates. This indicated that investors’ positioning and expectations were too bullish, the pace of growth was likely peaking, and that cyclical rally was over. 1Q18 earnings season was a harbinger of a tough year of PE multiple compression and weak stock performance, despite the strong year-over-year earnings growth fueled by tax cuts.
You can see the 2018 dynamic in Chart 1 in the purple circle. Despite a year of strong earnings beats vs. consensus, the S&P 500 price fell over 7% due to multiple compression. A few things contributed to this poor performance including: the stretched optimism and long positioning to start 2018 created a “high bar” for earnings results to beat investor expectations and spur further buying; the reality that this was “as good as it gets” from a year-over-year growth perspective (the 2nd derivative at work); at the same time that underlying economic momentum was slowing in the face of valuations that were very full (we call this trading “peak on peak”); and lastly the Fed was tightening monetary policy, putting further pressure on multiples and likely solidifying expectations that cyclical economic momentum would slow.
Of course, divergences do not have to happen, such as in 2020 when big earnings beats in the 2Q20 and 3Q20 earnings season (see the red circle in Chart 1) were met with strong stock price performance. This showed the possibility that investors were underweight or too negative on the outlook for companies, thus driving upside to stocks as these expectations and positions were recalibrated higher.
Chart 1: S&P 500 Quarterly Earnings End of Quarter Estimates vs. Actual Shows Big Beats to Expectations in 2Q20 and 3Q20, contributing to upside in the market
As we said at the start, it is much too early to tell what the message from 4Q20 earnings will turn out to be, if there is one at all. We will be watching closely, however, because we do observe parallels to early 2018. We have extreme bullish sentiment (AAII Bull/Bear at highest since 2018), and stretched investor positioning (cash balances even lower than 2018, put/call ratio lower than 2018). A peaking in economic momentum could also be observed as we move into the spring months (PMI already above 60, YoY growth of stimulus slows materially in March/April, easiest YoY earnings comparison in 2Q21). Of course, the one thing that is different from 2018, and what may prove to be most important, is that the Fed is not in the process of tightening monetary policy. We address this next.
“Seasons Don’t Fear the Taper”
One of the possible risks we highlighted in our 2021 Market Outlook was a slowing in the growth rate or even a reduction in the extraordinary amount of accommodation that the Fed has been providing markets. We do not see interest rate hikes on the horizon for the next 12-24 months (thanks to “air cover” from unemployment remaining well above pre-pandemic levels and the Fed’s preferred measure of inflation, Core PCE, remaining below its 2%, now average, target). However, we did highlight that there could be pressure to taper, or to at least start talking about tapering, the $120B/month of asset purchases later this year, mostly as growth and headline inflation numbers started to look much better in the spring of 2021. Some of this incrementally hawkish rhetoric was starting to pick up from Fed governors at the start of the year (see here). This is a risk because we see markets “hooked on liquidity”, highly sensitive to incremental changes in Fed stimulus and likely to fiercely protest even a slight reduction in accommodation. We’re not the only ones who see this as a risk: the Fed sees it too, and they appear intent on not being the source of market weakness.
Last week, Fed Chairman Jerome Powell spoke on a video conference where he gave a clear message that the Fed has no intention of reducing policy accommodation anytime soon (see here for the full video, see here for the transcript from WSJ, or see here for a Bloomberg summary). Powell is clearly wanting to avoid a repeat of volatile markets during Bernanke’s 2013 “taper tantrum” and the violent sell-off in late 2018 during his own policy tightening effort. He directly addressed the market’s sensitivity to incremental liquidity during this video presentation:
“And I think the taper tantrum, you know, as you asked about the taper tantrum, it highlights, I think, the real sensitivity that markets can have about the path of asset purchases. So you know, we know we need to be very careful in communicating about asset purchases… We will communicate very clearly to the public and we’ll do so, by the way, well in advance of active consideration of beginning a gradual table of asset purchases.”
As we described in last week’s Fieldpoint Monday Morning Update (see here), the Fed is not at all concerned at this time that current frothy conditions could create risks for future financial stability. Thus, the Fed is more concerned about preventing near term market weakness than stepping in to dampen destabilizing speculative behavior.
This brings us back to our key point when considering bubbly conditions: they can persist for some time and become even more extreme. Fed Chair Alan Greenspan first expressed concern that “irrational exuberance,” not changes in intrinsic value, was driving stock prices higher in December of 1996. This was well before the headiest, most irrational days of the 90’s bubble, and over three years before the bubble’s burst. Powell hasn’t even batted an eye at some of the wild and crazy characteristics of recent market trading (like early 2021’s penny stock boom, many others detailed in our 2021 Outlook).
With Powell and the Fed willing to continue extraordinary policy support in the face of an improving economic outlook and larger fiscal stimulus (next week we will be diving into the changing interplay between fiscal and monetary policy), these frothy conditions could persist and intensify. It is notoriously hard to predict an expiration date for a bubble, but that doesn’t mean the risks should be ignored or that speculative price action should be chased with abandon. We don’t want to commit the fatal mistake of “fighting the Fed”, recognizing that this upside momentum can persist, but we also want to be acutely aware of risks that are building and remain disciplined as narratives emerge to justify jaw-dropping price action.
For now, Powell may be singing his version of Blue Oyster Cult: “We’ll be able to fly, don’t fear the taper.”
Last Week in Markets: Equities Choppy, Bond Yields Down Despite Stimulus, Stretched Positioning in Dollar and Commodities
US equity markets had a choppy week of trading that resulted in large cap indices closing down for the week due to weak trading on Thursday and Friday (S&P 500 -1.48%, Nasdaq -1.54%, Dow Jones Industrial -0.91%). The late week weakness was ascribed to weaker/cautious bank earnings, disappointing retail sales and jobs numbers, and a muted reception to Biden’s proposed $1.9T stimulus plan. Small and Mid- caps outperformed for the fourth week in a row (Russell 2000 +1.51%, S&P 400 Midcap +0.32%), with the Russell 2000 already up +7.51% YTD (vs. only +0.32% for the S&P 500). Also continuing a similar rotation theme, Value (-0.15%) outperformed Growth (-2.37%) again this week.
From a sector perspective, it was a mixed message with risk-off/defensive areas like Utilities (+1.06%) and Real Estate (+1.85%) outperforming at the same time that cyclical Energy (+3.13%) outperformed, thanks to news of a larger-than-expected draw down in U.S. oil inventories early in the week (Inventories -5.8M barrels vs. -2.3M cons; article here). Financial stocks were up slightly on the week (+0.03%), but large names came under pressure at the end of the week due to a poor reception to the start of 4Q20 earnings results (see BI article here). The remaining sectors were down on the week with notable declines in Communication Services (-3.56%), Technology (-2.62%), and Consumer Staples (-1.99%). Semi-conductors (+1.92%) vs. Software (-3.29%) continue to communicate a risk-on, pro-cyclical message.
Analysts have raised their expectations for earnings for the 4Q20 from -9.2% on December 31, 2020 to -6.8% last week. Of the 26 S&P 500 companies that have reported earnings for 4Q20, 96% have beaten estimates with an average beat of 26.2% (see FactSet analysis here).
Bonds
Despite the release of President-elect Biden’s $1.9T stimulus plan, U.S. government bonds yields fell on the week (2 Year -1 bps to 0.13%, 5 Year -6 bps to 0.45%, 10 Year -6bps to 1.08%, 30 Year -5 bps to 1.83%). This yield action resulted in a curve flattening for the week -5 bps, but the curve still remains over 15 bps steeper than at the end of 2020. Inflation expectations did edge higher for the week by 0.02%, still hovering around the 2% level.
Dollar
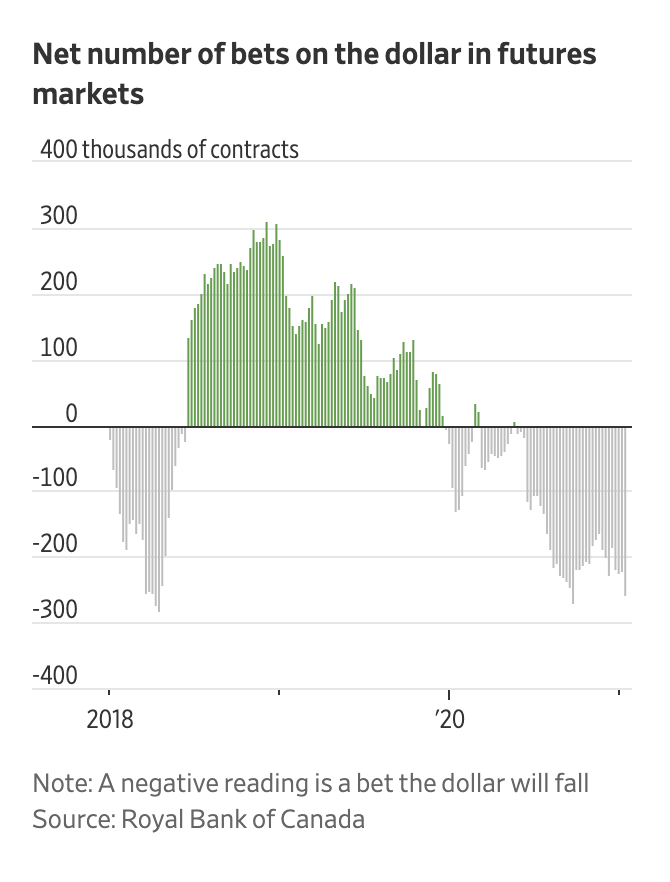
The dollar was slightly stronger on the week (+0.34% to 90.77). As expected, the dollar has recently bounced to stronger levels off of a long-term critical support level. We continue to see weak medium-term momentum for the dollar, along with fundamental downside pressures (inflation differentials, twin deficits, etc.). In the near term, and as describe in last week’s update (see here), positioning in the dollar is very bearish and one-sided (see Chart 2). An unwind of this positioning could put upward pressure on the dollar in the very near-term before the medium-term momentum and fundamental headwinds exert pressure to the downside. Naturally, this view of more dollar weakness to come after the recent bounce is consensus itself (see WSJ article here).
Watch on Tuesday as Treasury Secretary nominee, Janet Yellen, testifies to Congress. She is expected to affirm “commitment to market-determined exchange rates”, which would be a departure from the Trump administration’s outright calls for a weaker dollar (see WSJ article here). Committing to a market-based based approach has emboldened traders to increase shorts on the dollar to a three year high (see Bloomberg article here), as investors see the pressures from higher fiscal stimulus and twin deficits as drivers of further market-based dollar weakness.
Chart 2: Investors Betting On Dollar Weakness
Commodities
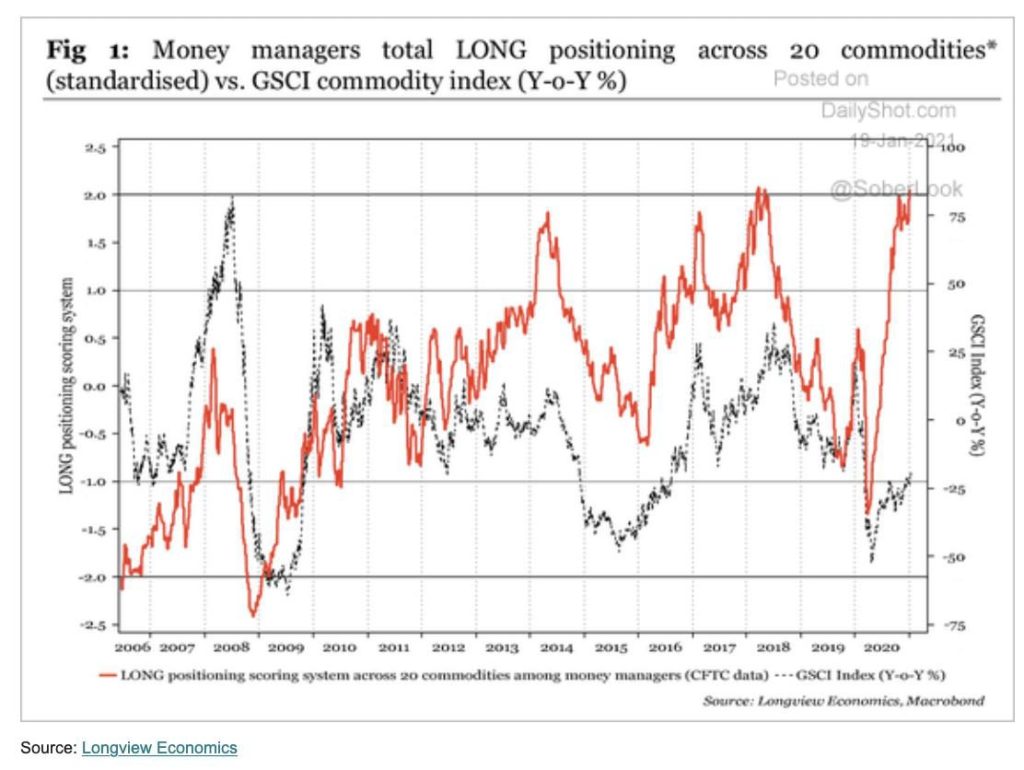
As described in the equity sector section, crude prices got a mid-week lift from a larger-than-expected drawdown in U.S. oil inventories (WTI +0.3%, +7.8% YTD). Gold prices continued their YTD slide (-0.3% for the week, -3.4% YTD), partially due to pressure from the stronger dollar. Similar to one-sided bearish positioning in the dollar, bullish positioning in commodities has reached the highest levels in over a decade (see Chart 3, via The Daily Shot). This could create a hurdle for further upside in the near term.
Chart 3: Bullish Commodity Positioning the Highest in over a Decade (has exceeded 2018 levels
Last Week Economic Data: Stimulus, Retail Sales, Jobless Claims
Weaker data from retail sales and jobs is leading investors to expect higher fiscal stimulus support for the economy.
Stimulus
President-elect Biden released the outline of a $1.9T stimulus packaged on Thursday evening. This incremental stimulus would be double the size of the bill passed in December and nearly the size of the CARES Act (see here for an analysis by Moody’s). The market does not expect this full stimulus to be able to be passed given the slimmest of Democrat majorities in the Senate, which would likely require Democrats to pursue stimulus through the budget reconciliation process (see Bloomberg article here for a good overview).
Retail Sales
Retail sales dropped unexpectedly in December 2020 (-0.7% vs. 0% cons), the third straight monthly decline. Interestingly, the decline couldn’t be blamed just on pandemic hit areas, because it showed the decline was concentrated in online sales. November retail sales were also revised lower (-1.4% vs. 1.1% prior).
Jobless Claims
Weekly jobless claims came in at 965k (vs. 800k cons), the highest level since mid-August (see article here).
This Week Data
• Monday: Markets closed for Martin Luther King Jr. birthday observed
• Tuesday: No major reports
• Wednesday: Inauguration of Biden administration; Housing Market Index
• Thursday: Weekly Unemployment Claims; Housing Starts
• Friday: Existing Home Sales
Disclosures
IMPORTANT LEGAL INFORMATION
This material is for informational purposes only and is not intended to be an offer or solicitation to purchase or sell any security or to employ a specific investment strategy. It is intended solely for the information of those to whom it is distributed by Fieldpoint Private. No part of this material may be reproduced or retransmitted in any manner without prior written permission of Fieldpoint Private. Fieldpoint Private does not represent, warrant or guarantee that this material is accurate, complete or suitable for any purpose and it should not be used as the sole basis for investment decisions. The information used in preparing these materials may have been obtained from public sources. Fieldpoint Private assumes no responsibility for independent verification of such information and has relied on such information being complete and accurate in all material respects. Fieldpoint Private assumes no obligation to update or otherwise revise these materials. This material does not contain all of the information that a prospective investor may wish to consider and is not to be relied upon or used in substitution for the exercise of independent judgment. To the extent such information includes estimates and forecasts of future financial performance it may have been obtained from public or third-party sources. We have assumed that such estimates and forecasts have been reasonably prepared on bases reflecting the best currently available estimates and judgments of such sources or represent reasonable estimates. Any pricing or valuation of securities or other assets contained in this material is as of the date provided, as prices fluctuate on a daily basis. Past performance is not a guarantee of future results. Fieldpoint Private does not provide legal or tax advice. Nothing contained herein should be construed as tax, accounting or legal advice. Prior to investing you should consult your accounting, tax, and legal advisors to understand the implications of such an investment.
Fieldpoint Private Securities, LLC is a wholly-owned subsidiary of Fieldpoint Private Bank & Trust (the “Bank”). Wealth management, securities brokerage and investment advisory services offered by Fieldpoint Private Securities, LLC and/or any non-deposit investment products that ultimately may be acquired as a result of the Bank’s investment advisory services:
Such services are not deposits or other obligations of the Bank:

− Are not insured or guaranteed by the FDIC, any agency of the US or the Bank
− Are not a condition to the provision or term of any banking service or activity
− May be purchased from any agent or company and the member’s choice will not affect current or future credit decisions, and
− Involve investment risk, including possible loss of principal or loss of value.
© 2021 Fieldpoint Private
Banking Services: Fieldpoint Private Bank & Trust. Member FDIC.
Registered Investment Advisor: Fieldpoint Private Securities, LLC is an SEC Registered Investment Advisor and Broker Dealer. Member FINRA, MSRB and SIPC.
Cameron Dawson
CFA®,
Chief Market
Strategist
Johnny Gibson
CFA®, Chief Investment Officer