
Weekly Perspective: New Regime, Who’s This?

The U.S. government is about to release nearly $3 trillion of fiscal stimulus on an economy that is expected to grow at its fastest pace in nearly 30 years and has a 6.2% unemployment rate, only slightly above the long-term average of 5.8% (80 year average).
All the while, monetary stimulus is committed to remaining highly accommodative, even in the face of data that might have perpetuated tightening under prior policy approaches (thanks to the Fed’s new average inflation targeting approach).
Without making a value judgment of right or wrong (we detail the arguments on both sides in this piece), we must appreciate that this is a major regime change in approach to fiscal and monetary policy.
Austerity is dead. Deficits are tolerable. Direct checks are the answer to recessions. Monetary policy is no longer the only game in stimulus town. The Fed is no longer “trigger happy” on tightening when it sees inflation.
With such a meaningful shift in policy, we must ask ourselves: Will the macro characteristics of the prior regime persist in the new regime? Will the same assets that worked under the prior regime work in this new regime?
The answer to these questions could be “yes”, nothing will change in this new regime: sticky inflation will not materialize, long term interest rates will remain in a long term downtrend, Growth will continue to dominate Value, the U.S. will continue to outperform international markets, stocks and bonds will be positively correlated in strong markets and negatively correlated in weak markets, etc. We cannot write off this outcome, lest we forget how the fears of inflation following the major policy change of quantitative easing proved to be wholly misplaced (see WSJ Open Letter to Ben Bernanke in 2010). However, to expect no impact from the regime change, you have to be able to argue that there will be limited consequences to dousing the economy with dual fire hoses of fiscal and monetary stimulus (of which the former was far more limited in 2010), and that this new territory of deficit spending has no net downside.
But what if there are consequences? Both equity and bond prices are historically very expensive. This market strength has been built on the overarching notion that sticky inflation is eradicated and money will remain exceedingly cheap. This has allowed for high leverage and high valuations to proliferate. But if these notions about elusive inflation and perpetually cheap money get challenged by a new policy regime, this construct of high leverage and high valuations could see brutal unwinds.
This is what the market has been wrestling with year-to-date. The speed of the selloff in long bonds, the massive rotations out of long-time Growth winners into long-neglected Value sectors, stocks and bonds both going down at the same time, and the sharp moves higher in commodity prices, all indicate a market contemplating the impact of this regime change.
We do not think investors need to make a resolute call on the impacts of this regime change in order to justify shifting some capital out of the winners of the prior regime into the losers of the prior regime. The performance differentials over the last 10 years of pairs like Growth vs. Value (Growth +300%, Value +100%) or Domestic vs. Emerging Markets (S&P 500 +190%, Emerging Markets +11%) are so large that a rebalancing is warranted. A similar picture can be painted with factors: the dividend factor produced a negative return of -20% over the past 7 years, compared to a positive return of +28% for the momentum factor (methodology explain in equity section below).
A near term resurgence in prior winners, like Growth, may not be out of the question. These Growth names are popular with retail traders who are about to receive more stimulus checks (recall the retail trading surge that came on the heels of prior stimulus checks, see Business Insider article here). But given the long-term impacts of this policy regime change, we would use near term strength to rotate into the new regime leadership.
Last Week in Markets: Choppy Equities, Factor Rotations; Long Bond Yields Continue Rise; Stronger Dollar, Higher Oil
Equities
Equity trading was choppy (meaning a lot of intraweek volatility) last week with notable divergences in the performance of large cap indices (S&P 500 +0.81%; NASDAQ -2.06%; Dow Jones Industrial Average +1.82%). Smaller cap sizes were also choppy and mixed (mid-cap +0.67%; small-cap -0.40%). Growth (-1.78%) materially underperformed Value (+2.59%) as the rotation out of last year’s winners (tech, momentum, long-duration, lock-down benefitting stocks) continued.
Table 1 shows the sector performance of the S&P 500 last week and YTD. The dominant trend continues to be outperformance of sectors that benefit from higher interest rates (Financials) and higher commodity prices (Energy). Note that last week, defensive and rate sensitive sectors (Consumer Staples, Utilities) were positive on the week, halting a string of underperformance caused by investors seeking out more cyclical exposure. We will need to watch to performance of these defensive areas closely in order to determine if investors are turning more “risk-off”.
Table 1: S&P 500 Sector Performance
| Index Name | 1 Week | YTD |
| Consumer Discretionary | -2.8% | -3.4% |
| Consumer Staples | 1.9% | -5.0% |
| Communication Services | 2.4% | 7.1% |
| Energy | 10.1% | 38.6% |
| Financials | 4.3% | 13.9% |
| Health Care | 0.3% | -0.7% |
| Industrials | 3.1% | 5.1% |
| Materials | 2.3% | 3.5% |
| Tech | -1.4% | -1.3% |
| Utilities | 2.1% | -5.5% |
| Real Estates | -1.4% | 0.5% |
Source: Bloomberg, Fieldpoint Private, as of 3/6/21
Looking at factors also exposes the rapidity of this rotation and how performance leadership has changed materially since last year. Table 2 shows the returns for various factors in the US All Cap universe. For example the Value factor performance is calculated as a long/buy position in the cheapest names and a short/sell position in the most expensive names. What you can see is that this trading strategy has been deeply negative over the last year, but over the last week is sharply positive; same for dividends and profit. Conversely, Momentum (stocks that go up keep going up) was a big driver of performance over the last year but is now a detractor. “The first shall be last”.
Table 2: US All Cap Factor Performance (Net Long-Short Q1-Q5)
| Factor | 1 Week Relative | 1 Year Relative |
| Value | 11% | -26% |
| Dividend Yield | 7% | -31% |
| Profit | 4% | -35% |
| Market Cap | 0% | -18% |
| 5 Year Actual Sales Growth | -4% | 2% |
| Momentum | -9% | 19% |
Source: Bloomberg, Fieldpoint Private, as of 3/6/21
Fixed Income
Long bond yields continued their rise last week:
- 5-yr: +14 bps to 0.83%
- 10-yr: +18 bps to 1.6%
- 30-yr: +11 bps to 2.3%
Notably, longer term inflation expectations rose last week (+12 bps to 2.09%) after three weeks of declines. Recall that the move higher in rates over the past few weeks had actually not been driven by inflation expectations but actually higher term premiums (driven by maturity, fed policy expectations, supply/demand, rate differentials).
Short term yields rose as well (2-yr +3 bps to 0.15%) but not enough to keep the 10-2 Treasury curve from steepening further last week (+15 bps to 145 bps).
The Fed continued to communicate that it was not concerned (see Reuters article here) with the recent rise in bond yields, with Chairman Powell continuing to say that higher rates were a sign of strength in the economy. This spurred a sell-off on Thursday in both bond and equity markets, as the Fed threw cold water on the prospects of further stimulus to keep long interest rates down through curve control.
Notably, the volatility over the last two weeks is raising questions about the health of trading and liquidity in the U.S. market, which is supposed to be the world’s most liquid market. This Bloomberg article details how liquidity is present in the bond market, except when you need it most.
Currencies and Commodities
The U.S. Dollar strengthened last week (DXY +1.5% to $92.3). The strength in the Dollar in March (see Chart 1) is likely being driven by interest rate differentials (higher US Treasury rates can draw foreign capital into the U.S. resulting in increased demand for USD) and some risk-off sentiment. Recall that positioning was very bearish on the USD coming into 2021, leading us to expect a bounce or at least some pause in the decline that took hold in early 2020. Note that Chart 1 shows that we are still in a short term downtrend (below the 200-day moving average).
Oil rose sharply last week (WTI +7.7%, +36.5% YTD) and continued its price run through the weekend following an OPEC+ meeting and an attack on Saudi oil facilities (see Reuters article here). Precious metals declined last week (-2.94%) due to higher interest rates and a stronger dollar weighing on prices (Gold -2.04%; Silver -5.17%). Industrial metals (-2.45%) with Copper (-1.02%) and Iron Ore (+1.19%).
Chart 1: DXY 1 Year
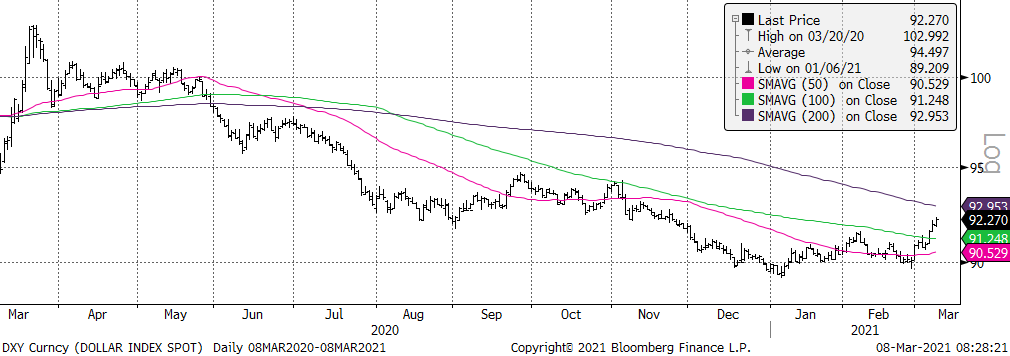
Source: Bloomberg
Disclosures
IMPORTANT LEGAL INFORMATION
This material is for informational purposes only and is not intended to be an offer or solicitation to purchase or sell any security or to employ a specific investment strategy. It is intended solely for the information of those to whom it is distributed by Fieldpoint Private. No part of this material may be reproduced or retransmitted in any manner without prior written permission of Fieldpoint Private. Fieldpoint Private does not represent, warrant or guarantee that this material is accurate, complete or suitable for any purpose and it should not be used as the sole basis for investment decisions. The information used in preparing these materials may have been obtained from public sources. Fieldpoint Private assumes no responsibility for independent verification of such information and has relied on such information being complete and accurate in all material respects. Fieldpoint Private assumes no obligation to update or otherwise revise these materials. This material does not contain all of the information that a prospective investor may wish to consider and is not to be relied upon or used in substitution for the exercise of independent judgment. To the extent such information includes estimates and forecasts of future financial performance it may have been obtained from public or third-party sources. We have assumed that such estimates and forecasts have been reasonably prepared on bases reflecting the best currently available estimates and judgments of such sources or represent reasonable estimates. Any pricing or valuation of securities or other assets contained in this material is as of the date provided, as prices fluctuate on a daily basis. Past performance is not a guarantee of future results. Fieldpoint Private does not provide legal or tax advice. Nothing contained herein should be construed as tax, accounting or legal advice. Prior to investing you should consult your accounting, tax, and legal advisors to understand the implications of such an investment.
Fieldpoint Private Securities, LLC is a wholly-owned subsidiary of Fieldpoint Private Bank & Trust (the “Bank”). Wealth management, securities brokerage and investment advisory services offered by Fieldpoint Private Securities, LLC and/or any non-deposit investment products that ultimately may be acquired as a result of the Bank’s investment advisory services:
Such services are not deposits or other obligations of the Bank:

− Are not insured or guaranteed by the FDIC, any agency of the US or the Bank
− Are not a condition to the provision or term of any banking service or activity
− May be purchased from any agent or company and the member’s choice will not affect current or future credit decisions, and
− Involve investment risk, including possible loss of principal or loss of value.
© 2021 Fieldpoint Private
Banking Services: Fieldpoint Private Bank & Trust. Member FDIC.
Registered Investment Advisor: Fieldpoint Private Securities, LLC is an SEC Registered Investment Advisor and Broker Dealer. Member FINRA, MSRB and SIPC.
Johnny Gibson
CFA®, Chief Investment Officer
Cameron Dawson
CFA®,
Chief Market
Strategist