
Invisible Gorillas Part 1: Counting Passes with One More Week on Inflation

I am loath to spend yet another week writing about inflation out of concern we could be falling prey to an invisible gorilla problem.
In a now well-known early 2000’s experiment, researchers Chabris and Simons had participants watch a video of people passing basketballs. Participants were asked to count how many times the people wearing white shirts passed the balls. At the end of the experiment, the researchers asked how many times the ball was passed, but also, “did you see the gorilla?”
Halfway through the basketball video, a woman in a gorilla suit walks to the center of the frame, pounds her chest and walks off. She’s on screen for nearly ten seconds.
However, so engrossed in getting the pass count right, more than half of the research participants did not see the gorilla. Further, once told about the gorilla, these participants expressed certainty that they simply could not have missed the gorilla.
This invisible gorilla has become synonymous with the plight of selective attention or inattentional blindness, along with the limitations of our intuition.
Said simply by the researchers, “This experiment reveals two things: that we are missing a lot of what goes on around us, and that we have no idea that we are missing so much.”
Interestingly, a decade later the researchers repeated the experiment. Participants who had seemingly wised up and were expecting the gorilla did, in fact, see the gorilla, but then missed other surprise occurrences, like the color of the background changing.
As Simons puts so incisively: “We consciously see only a small subset of our visual world, and when our attention is focused on one thing, we fail to notice other, unexpected things around us—including those we might want to see.”
So the question we face today is: by focusing so much attention on inflation, are we at risk of missing other market risks and opportunities, becoming inattentionally blind to today’s invisible gorillas?
An initial push back to the worthiness of this question is that factors in the market are far more intertwined than the components of the invisible gorilla experiment, meaning research participants might have been more likely to see the gorilla if it had interfered with the counting process by hip-checking one of the ball passers.
Inflation has far more ability to interfere with, or hip-check, other factors in financial markets. Inflation impacts monetary policy, fiscal policy, bond yields (only sort of these days), currencies, consumer/corporate confidence, consumer spending, capex, manufacturing cycles, debt cycles, valuations on high growth stocks, market rotations and more.
This could mean that focusing on inflation may not be all that blinding, as long as we appreciate it as part of a bigger, intertwined system, instead of singularly focusing on each month’s inflation data prints.
But then again, we are still human and know we are at risk of inattentive blindness and misleading intuition, so, here’s the plan for the next two weeks: we’ll spend this week essentially counting the passes of the players in white shirts, or looking at the takeaways from last week’s blow out inflation data. Then next week, we’ll look for invisible gorillas by intentionally looking for non-inflation related risks and opportunities in the market.
What You Need to Know from Last Week’s Inflation Data
Before we dive in, it may be helpful to revisit our inflation framing. For the quick take, we think:
- Inflation will continue to run hotter than the Fed’s expectations, not falling as fast as the Fed expects due to stickier drivers turning higher (housing/rents, wages, etc.) and transitory factors taking longer to clear (supply chain issues, energy prices, etc.)
- These higher and broader inflation reading could lead to more hawkish Fed commentary and action, along with the market pricing in tighter monetary policy today and slower growth in the future (a flatter yield curve)
- Higher inflation risks weighing on consumer sentiment and spending—consumers feel price level changes, not a slowing second derivate in the pace of inflation
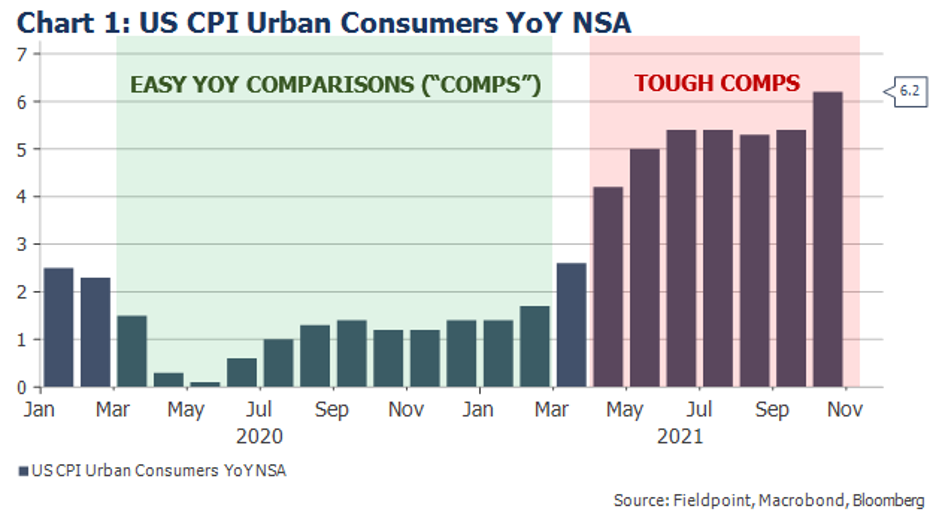
- We expect inflation to slow in late 2Q22 due to tough YoY comparisons (see Chart 1), while eventually today’s supply shortages can turn into tomorrow’s supply gluts
- At this time, we do not expect a repeat of the 1970s-1980s experience of sustained, very high inflation—there are key missing ingredients such as a substantial weakening in the dollar
So let’s hit the highlights of the October inflation data, along with the market reaction:
1. October inflation was higher than everyone (meaning experts and the Fed) expected
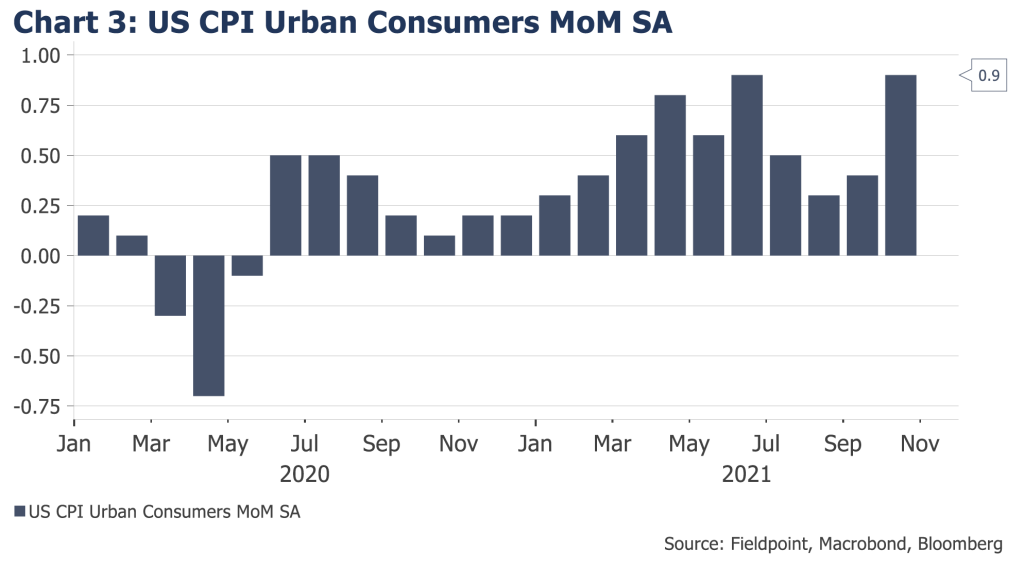
October headline CPI came in at +6.2% Year-over-Year (vs. +5.9% consensus) and accelerated to +0.9% Month-over-Month (vs. +0.6% consensus). As Bloomberg’s Markets Live Blog pointed out, none of the 70 economists surveyed expected MoM inflation to be higher than +0.7%.
2. October inflation showed a broadening out of inflation
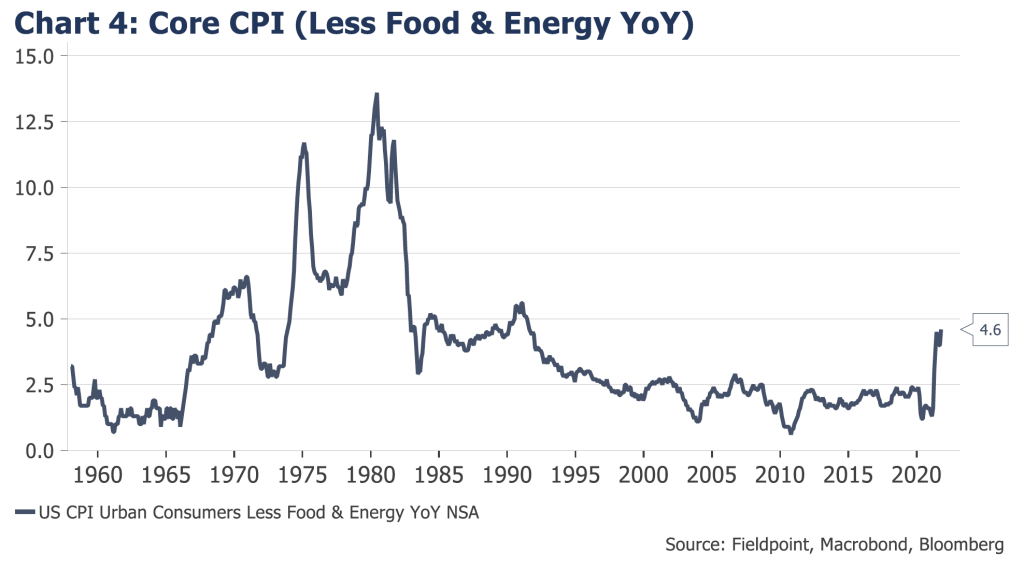
Core CPI, excluding food and energy, accelerated to +4.2%, the fastest pace since 1991 (Chart 4).
Nearly 40% of the components in the CPI now are showing gains above 4%.
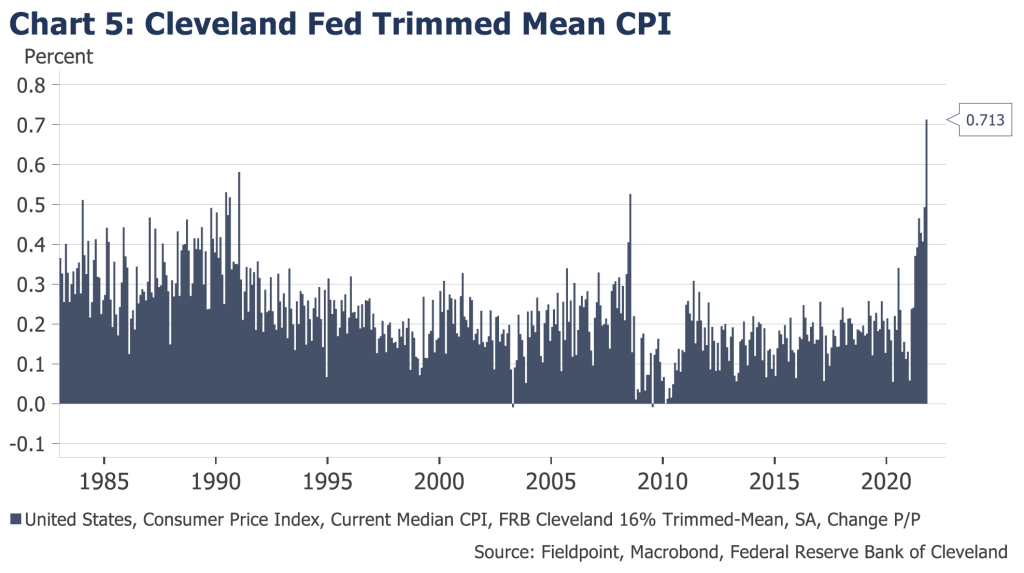
Another way to capture this is with a “trimmed mean” measure of CPI, which excludes those components with the most volatile price swings. Chart 5 shows how even this trimmed mean measure is showing a spike in inflation.
This is not just about used cars, hotels and airline tickets. Prices are rising throughout the economy.
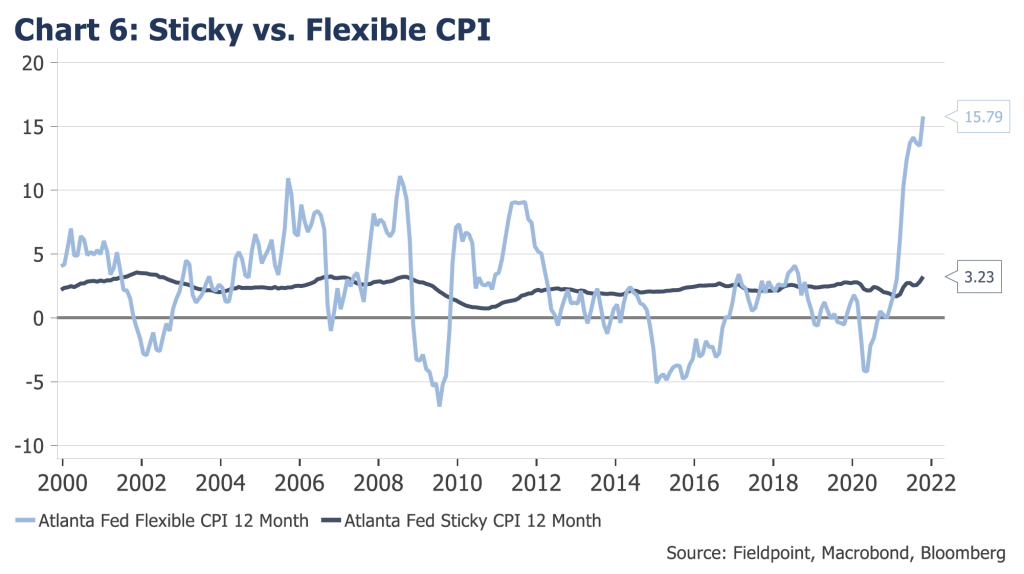
3. “Stickier” factors have started to move higher
The Atlanta Fed breaks down “sticky” components of the CPI that move relatively slowly and “flexible” components of the CPI that are more volatile. You can see the large jump in flexible components, but note the rise of the sticky measures. These sticky measures certainly do not fit the transitory motif (Chart 6).
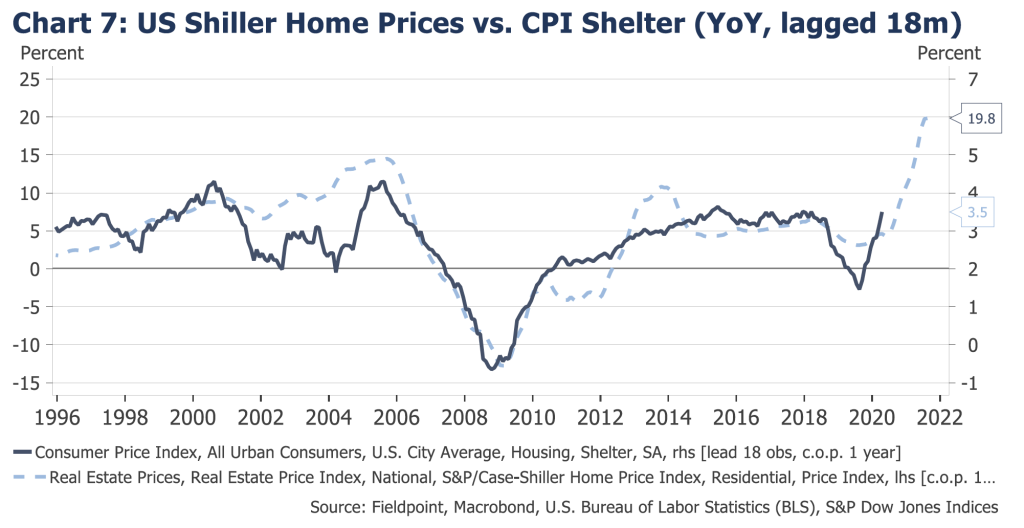
Specifically, as we have been anticipating for the past few months, the housing related components of the CPI (30-40% of the index) are starting to turn higher, following the rapid ascent of home prices.
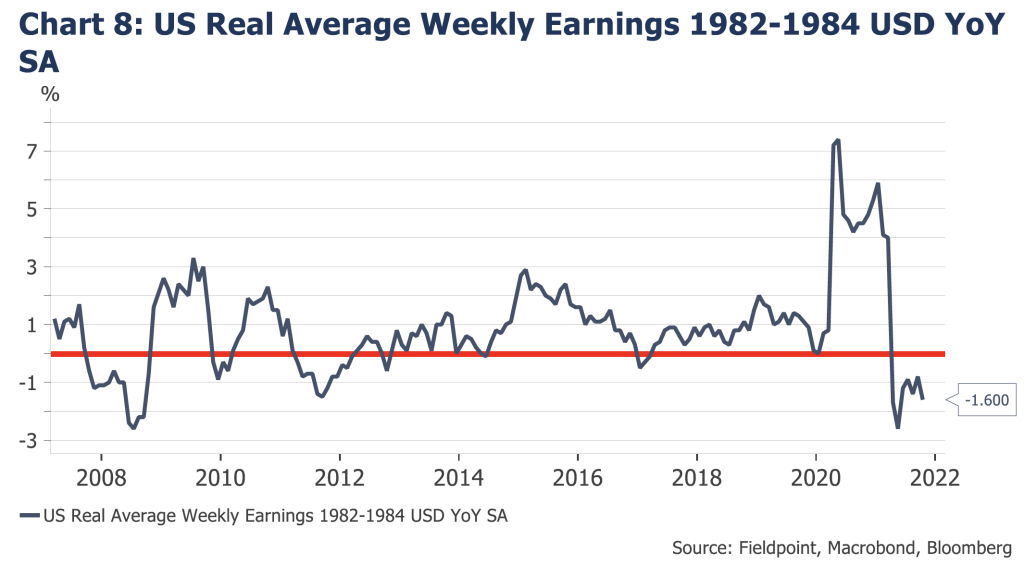
4. Prices are rising faster than wages, with real wage growth negative; this is a factor in weaker consumer sentiment
Wage growth minus inflation, or real wage growth, is negative, signaling that prices are rising faster than people’s income. If this continues, there is the risk that consumers will have to cut back on spending (or rely more on debt to fund purchases).
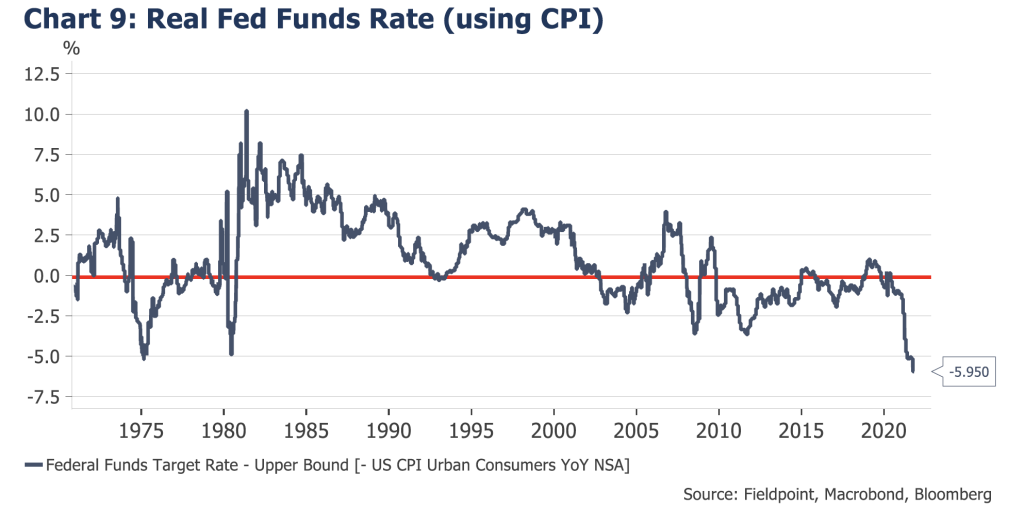
5. The Fed been this easy when inflation has been this high
The Real Fed Funds Rate (the Fed Funds Rate minus inflation) is the lowest it has ever been, representing extremely accommodative policy against the economic backdrop.
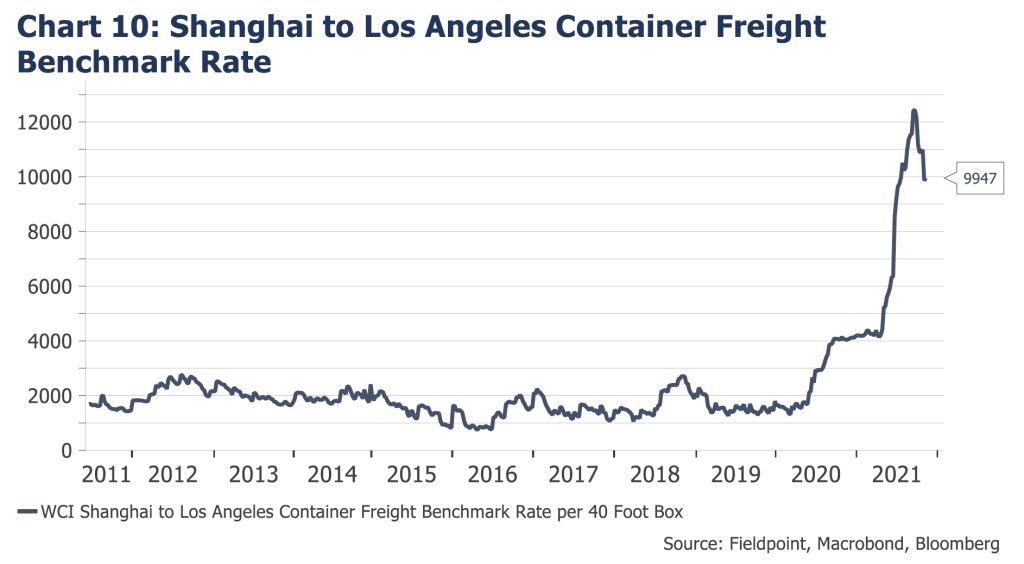
6. Could the worst be over? Some areas that have had the most acute inflation are showing signs of easing price expansion.
Shipping has been ground zero for rapid price increases, however there are growing signs that the pace of inflation in shipping costs is starting to slow. This does not mean that supply chain issues are fixed, but signals that as peak season shipping abates and new capacity is added, prices could continue to fall back towards (not necessarily to) normal.
With this idea planted of “peak inflation,” we are going to stop there for today.
Next week we will pick up with Part 2, looking for those invisible gorillas.
Disclosures
IMPORTANT LEGAL INFORMATION
This material is for informational purposes only and is not intended to be an offer or solicitation to purchase or sell any security or to employ a specific investment strategy. It is intended solely for the information of those to whom it is distributed by Fieldpoint Private. No part of this material may be reproduced or retransmitted in any manner without prior written permission of Fieldpoint Private. Fieldpoint Private does not represent, warrant or guarantee that this material is accurate, complete or suitable for any purpose and it should not be used as the sole basis for investment decisions. The information used in preparing these materials may have been obtained from public sources. Fieldpoint Private assumes no responsibility for independent verification of such information and has relied on such information being complete and accurate in all material respects. Fieldpoint Private assumes no obligation to update or otherwise revise these materials. This material does not contain all of the information that a prospective investor may wish to consider and is not to be relied upon or used in substitution for the exercise of independent judgment. To the extent such information includes estimates and forecasts of future financial performance it may have been obtained from public or third-party sources. We have assumed that such estimates and forecasts have been reasonably prepared on bases reflecting the best currently available estimates and judgments of such sources or represent reasonable estimates. Any pricing or valuation of securities or other assets contained in this material is as of the date provided, as prices fluctuate on a daily basis. Past performance is not a guarantee of future results. Fieldpoint Private does not provide legal or tax advice. Nothing contained herein should be construed as tax, accounting or legal advice. Prior to investing you should consult your accounting, tax, and legal advisors to understand the implications of such an investment.
Fieldpoint Private Securities, LLC is a wholly-owned subsidiary of Fieldpoint Private Bank & Trust (the “Bank”). Wealth management, securities brokerage and investment advisory services offered by Fieldpoint Private Securities, LLC and/or any non-deposit investment products that ultimately may be acquired as a result of the Bank’s investment advisory services:
Such services are not deposits or other obligations of the Bank:

− Are not insured or guaranteed by the FDIC, any agency of the US or the Bank
− Are not a condition to the provision or term of any banking service or activity
− May be purchased from any agent or company and the member’s choice will not affect current or future credit decisions, and
− Involve investment risk, including possible loss of principal or loss of value.
© 2021 Fieldpoint Private
Banking Services: Fieldpoint Private Bank & Trust. Member FDIC.
Registered Investment Advisor: Fieldpoint Private Securities, LLC is an SEC Registered Investment Advisor and Broker Dealer. Member FINRA, MSRB and SIPC.
Cameron Dawson
CFA®,
Chief Market
Strategist