
You Can’t Always Get What You Want: Lessons From Divergent Macro and Markets
Given the surge in yields on this first trading day of the year, it may seem unnecessary and backward looking to talk about the drivers of lower yields way back in 2021. But an understanding of why we saw macro and markets seemingly diverge last year is important for setting expectations for 2022, a year that is certainly to come with its own surprises.
Happy new year, all!
You Can’t Always Get What You Want
2021 was the year you could be completely right and wildly wrong at the same time.
It was the year that you could have called the economic backdrop perfectly, but if you had invested portfolios in a way that “should have” aligned with that forecast, your performance was likely lackluster.
Early in 2021 many forecasters said that the U.S. would experience a surge in inflation.
And they were right. The combination of easy year over year comparisons from 2020, strong demand supported by stimulus, shifting demand patterns due to the pandemic and supply issues from the challenges of reopening all came together to drive 40-year high readings in inflation statistics in 2021.
Investors fearing and positioning for this macro backdrop likely dusted off the old playbook for investing during a period of elevated inflation:
1) stay away from long term bonds because bond yields should rise with higher inflation readings, given inflation erodes the real value of the bond; 2) expect a weaker USD, as high inflation makes the currency less attractive; 3) buy gold (and digital gold now) as the purchasing power of the dollar is eroded; and 4) avoid Growth equities that struggle with higher yields and favor Value equities that benefit from stronger commodity prices and near term cash flows.
Oh boy, was this playbook wrong in practice.
The macro call for inflation was right, but asset prices did the opposite of what many expected in an inflationary environment.
Long bond yields fell (prices rose) as inflation took off, the USD rallied through the year, gold was a lackluster -4% on the year, digital gold peaked vs. the S&P 500 early in the year and Growth outperformed Value as real yields plunged.
This divergence in macro and asset prices in 2021 carries with it important lessons as we go into 2022.We can have confidence in a macro outlook, but simple, clean heuristics of what to buy/sell in a certain environment clearly are not enough to make positioning decisions.
So let’s start with the lessons for 2022 that we can learn from these divergences.
From there we’ll look at the specific example of how long term bonds bucked inflation trends in 2021.The path of interest rates is so critical for market returns and leadership, that we must appreciate what happened last year in order to be better prepared for 2022.
Get What You Need: Three Lessons for 2022
We will be publishing an outlook for 2022 in the coming weeks where we will discuss our macro expectations and how we will position to align with these forecasts. In preparation for this, there are a few lessons we can learn from the divergences from 2021.
1. When it comes to positioning think like a Brooklyn hipster: as soon as it gets crowded, it is not cool anymore.
Flows and positioning were key drivers of asset performance in 2021 (as they are in most years).
USD positioning was very short to start the year, helping fuel the rally in the dollar through the year. Flows into “inflation benefitting” assets like Value, cyclicals and commodities reached extremes just as the trades were peaking in March. Demand for Treasuries, whether for superior yield or defensive exposure, helped drive down long yields.
As we start 2022, we can make a few observations about positioning/flows. First, traders are now short long term Treasuries, betting that yields will rise in 2022 (along with consensus forecasts being for higher yields). Second, traders are now long the USD (but not so crowded that it portends an immediate reversal in trend, just that the tailwind from short covering is gone). Third, flows into Growth are at an extreme as investors crowd into the most popular names.
Before we make predictions and set positions, we need to pay careful attention to where others are already most confident and most exposed.
2. What you think is important for markets may be a distraction from the real drivers.
In 2021 the distraction was inflation, whereas the real drivers for asset prices were flows, liquidity and peaking economic momentum (described in the bond section below).
This could be because high inflation did not force the Fed to act immediately to raise rates, allowing policy to stay accommodative. Easy policy plus high inflation resulted in very negative real yields, driving Growth stocks higher.
Inflation could also have been a distraction because it wasn’t affecting the real economy yet. Despite surveys saying that consumers were feeling the pinch from higher inflation, like the University of Michigan Consumer Sentiment Index, consumers kept spending through the year. Further, despite businesses complaining about higher costs, corporate margins kept expanding thanks to strong pricing power and demand.
Of course if inflation persists while incomes start to stagnate and growth slows enough to reduce pricing power, or if the Fed moves to aggressively respond to inflation, we could find ourselves in a scenario where inflation actually is a driver of markets in 2022. This remains to be seen.
3. Markets are a relative sport.
I get questions frequently that follow the structure, “if the Fed does ___, what does it mean for ___?”
The answer is always an unsatisfying: it depends.
This is because the Fed does not impact markets in a vacuum.Of course Fed action is important, but it is just as important what the Fed is doing relative to other central banks.
The example of 2014 and the USD is salient. The Fed started gradually tapering in early 2014, while the ECB and BOJ started easing later in the year. The Fed being much tighter than the other major central banks resulted in a massive 27% rally in the USD in just 10 months. This USD rally cracked commodity prices and kicked off the industrial recession. It wasn’t that Fed policy was so tight, it was that it was tight relative to other central banks.
As we look to 2022, we can see that the Fed is set to taper and then tighten policy. The path of the dollar will thus depend on how aggressive the Fed is compared to the ECB and BOJ, primarily (and the PBOC to a lesser extent, which has already started to ease policy to support flagging Chinese growth).
A similar analysis can be done for flows in and out of Treasuries: higher US yields have quickly drawn in flows into USD denominated assets as the global savings glut searches for yield, regardless of inflation readings.
Always remember that markets are a relative sport.
These are the lessons we will take with us as we look into 2022. You can stop here if you do not have interest in a discussion about yields and inflation, but read on to make sense of why there was a such a large divergence between this asset price and the macro in 2021.
Get My Fair Share of Abuse: The Long Bond Example
The peculiarity of 2021 is that the trades that were supposed to benefit from an inflationary environment (and console those who were afraid of runaway inflation), began underperforming just as inflation readings were starting to pick up and surprise to the upside.
Take long bonds’ interaction with inflation data for example.
Bonds initially sold off (yields rose) in 2021 driven by higher growth and inflation expectations, along with the expectation that the Fed was going to remain very dovish given their new “average inflation targeting” approach (this initial sell off is what drove bonds to have their worst year since 1999).
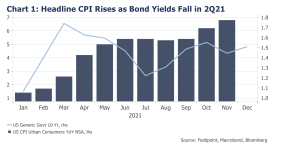
March 2021 was the first month since the pandemic that inflation rose above 2% (headline CPI).From March, inflation accelerated to nearly 7% to close out the year (Chart 1).
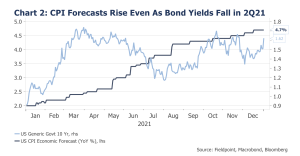
Inflation also surprised to the upside. Throughout the year, forecasters were forced to march up their estimates for annual inflation. The Bloomberg consensus estimate for 2021 inflation rose from 2% to start the year, all the way up to 4.7% today (Chart 2).
But throughout all of this acceleration and upside surprise in inflation, bond yields did not rise as many expected. Instead, they fell!
The yield on the 10 year Treasury peaked in late March at just 1.7% and thendropped 50 bps in the following five months, just as the inflation fear fever pitch was starting to take hold.
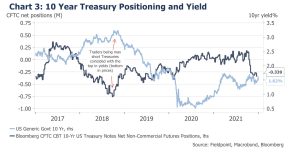
Interestingly, it does not appear that we can blame trader positioning for this rally in bond prices/fall in bond yields. If traders were already very short 10 year Treasury bonds (anticipating inflation and expecting yields to rise), the rally in bond prices could have been caused by short covering.
Chart 3 shows that traders were not short 10 year’s in March 2021, so the rally in bonds was not an unwind in short positioning.
An aside to appreciate, traders are short 10 Year Treasuries today, reflecting that traders are agreeing with forecasters that rates could rise in 2022 (Bloomberg consensus is for 2.04% on the 10 year by 4Q22).
There is a cautionary tale here: look at 2018’s max short position in 10 Year Treasuries coinciding with the peak in bond yields/low in bond prices that year. Yields proceeded to be cut in half in just the following 8 months (a big rally in bonds) and traders were forced to unwind this positioning. Be cautious when everyone is already on one side of the boat….
So why did bonds rally/yields fall starting in late March, just as inflation was picking up?
One reason is that, instead of short covering, there were other positioning/flow drivers that likely pushed down bond yields, such as demand from yield seeking foreign investors, significant buying by banks, and continued Fed QE buying. This high demand was met with light Treasury issuance, as the Treasury spent down its elevated cash balance with the Fed. Demand was greater than supply, resulting in higher prices (lower yields).
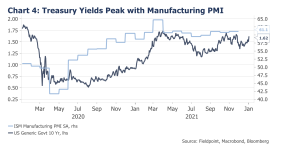
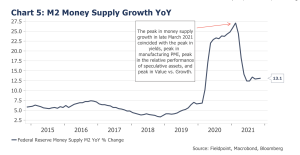
Another reason, is that there is also the coincidence or correlation that bond yields peaked just as economic momentum peaked, as captured by the US Manufacturing Purchasing Managers Index (Chart 4). The peak in yields and economic momentum also coincided with the peak in liquidity growth, as measured by the M2 Money Supply Growth YoY in late March (Chart 5). Less economic momentum and liquidity meant lower out year growth/inflation and possibly more risk-off/defensive positioning, and thus lower yields.
Lastly, the Fed also pivoted its policy “reaction function” to be more hawkish in June, indicating that they would be more inclined to move to try to control inflation rather than letting it “run hot.” This lowered long term growth and inflation expectations, resulting in lower yields.
But why do we care so much about yields?
It is because this movement in yields, and the receding liquidity tide, was critical for many other assets in the market in 2021. If you tried to fight the movement in yields, possibly because of compelling narratives, you likely got your “fair share of abuse”:
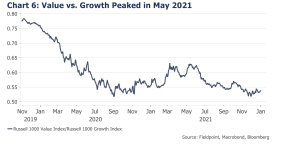
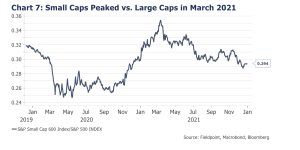
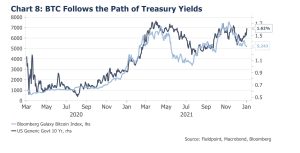
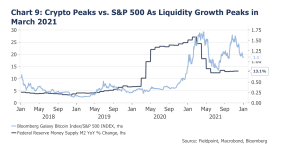
Value vs. Growth peaked with yields in May (Chart 6).Small Cap vs. Large Cap peaked with yields in March (Chart 7).Digital gold (BTC) followed the pattern of rates closely on an absolute basis, and peaked vs. the S&P 500 in late March as well (Chart 8, 9).As we described in December, speculative assets broadly peaked in late March as well, including SPACs vs. S&P 500, “Innovation” vs. S&P 500, or Biotech vs. S&P 500.
This leaves us with the question of what to expect for yields in 2022, since they are such critical drivers of market leadership.
But given we’ve prattled on for long enough this morning, we’ll save that discussion for next week.
IMPORTANT LEGAL INFORMATION
This material is for informational purposes only and is not intended to be an offer or solicitation to purchase or sell any security or to employ a specific investment strategy. It is intended solely for the information of those to whom it is distributed by Fieldpoint Private. No part of this material may be reproduced or retransmitted in any manner without prior written permission of Fieldpoint Private. Fieldpoint Private does not represent, warrant or guarantee that this material is accurate, complete or suitable for any purpose and it should not be used as the sole basis for investment decisions. The information used in preparing these materials may have been obtained from public sources. Fieldpoint Private assumes no responsibility for independent verification of such information and has relied on such information being complete and accurate in all material respects. Fieldpoint Private assumes no obligation to update or otherwise revise these materials. This material does not contain all of the information that a prospective investor may wish to consider and is not to be relied upon or used in substitution for the exercise of independent judgment. To the extent such information includes estimates and forecasts of future financial performance it may have been obtained from public or third-party sources. We have assumed that such estimates and forecasts have been reasonably prepared on bases reflecting the best currently available estimates and judgments of such sources or represent reasonable estimates. Any pricing or valuation of securities or other assets contained in this material is as of the date provided, as prices fluctuate on a daily basis. Past performance is not a guarantee of future results. Fieldpoint Private does not provide legal or tax advice. Nothing contained herein should be construed as tax, accounting or legal advice. Prior to investing you should consult your accounting, tax, and legal advisors to understand the implications of such an investment.
Fieldpoint Private Securities, LLC is a wholly-owned subsidiary of Fieldpoint Private Bank & Trust (the “Bank”). Wealth management, securities brokerage and investment advisory services offered by Fieldpoint Private Securities, LLC and/or any non-deposit investment products that ultimately may be acquired as a result of the Bank’s investment advisory services:
Such services are not deposits or other obligations of the Bank:

− Are not insured or guaranteed by the FDIC, any agency of the US or the Bank
− Are not a condition to the provision or term of any banking service or activity
− May be purchased from any agent or company and the member’s choice will not affect current or future credit decisions, and
− Involve investment risk, including possible loss of principal or loss of value.
© 2021 Fieldpoint Private
Banking Services: Fieldpoint Private Bank & Trust. Member FDIC.
Registered Investment Advisor: Fieldpoint Private Securities, LLC is an SEC Registered Investment Advisor and Broker Dealer. Member FINRA, MSRB and SIPC.
Cameron Dawson
CFA®,
Chief Market
Strategist