
Every Rose Has Its Thorn: The Good and the Bad of 4Q21 Earnings Season

There’s no better way to celebrate the Feast of Saint Valentine than with a good old fashioned glam power ballad (preferably if you’ve teased out your hair and have a stereo that goes up to 11).
There is ample wisdom and perspective in these soaring, heartfelt tracks, from White Snake teaching us about the power of independent thinking, to Aerosmith teaching us about goal setting, to Meatloaf teaching us about establishing healthy boundaries.
Today we turn to Poison, who teaches us a valuable lesson for this earnings season: that there is good (a rose) and bad (a thorn) in everything.
In looking for our earnings roses and thorns: S&P 500 companies are beating estimates, BUT they are doing so at a smaller magnitude and less broadly than in recent quarters. Earnings growth was strong this past quarter, BUT companies are cutting forward guidance. Many sectors have posted strong earnings beats for 4Q21, BUT their stock returns have been weak YTD.
So let’s dive in to the details of these roses and thorns (fully acknowledging the irony in learning balance from a music genre that specialized in excess).
Every Night Has Its Dawn: S&P 500 4Q21 Earnings
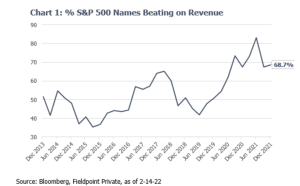
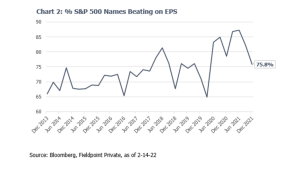
On the surface, this earnings season has been another strong one: of the 72% of S&P 500 companies that have reported their 4Q21 earnings results, 69% have beat revenue estimates and 76% have beat earnings estimates (Charts 1 and 2).
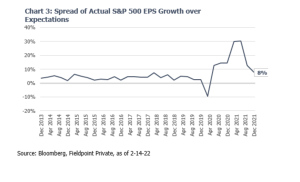
Overall, earnings are coming in 8.6% above Street estimates, for an all-in growth rate of 30% for the S&P 500.
Charts 3 shows how the significant earnings upside surprises were a key feature of the post-COVID equity market. In the past two years, analysts struggled to calibrate how lockdowns, restrictions and stimulus would influence companies’ sales, margins and earnings. Overall, analysts vastly underestimated the ability of companies to grow top line revenues and defend margins against cost inflation and other disruptions (see how earnings came in 30% above estimates in early 2021!).
It is important to appreciate that these big upside surprises to earnings were a huge driver of supernormal equity returns over the past two years, mainly in 2021 when strong earnings (+50% growth) were able to more than offset P/E multiple compression, allowing for a nearly 30% gain in the S&P 500.
But the message from Chart 3 is clear: this tailwind from upside earnings surprises is fading. Estimates have already been raised, demand is returning to more normal patterns and YoY comparisons are tougher. All of this means that earnings growth and upside surprises will not be the source for big equity upside like they were in the past two years. This, in addition to an expectation for P/E multiples to fall as the Fed tightens monetary policy, is why we expect much lower returns for equities in 2022 compared to 2019-2021.
Did the Words Not Come Out Right: The Reactions and Guides
Despite the positive surprises this quarter, the reaction to earnings results has been more muted.
Chart 4 shows the one-day reaction of earnings beats and misses. You can see that several sectors within the S&P 500 have delivered upside surprises to earnings, but the stocks have sold off on the day of the earnings release.
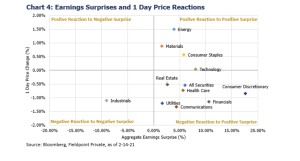
This can be due to investors having higher expectations for the earnings (compared to the sell-side analysts who make up “consensus”), low quality earnings beats (due to below-the-line items like tax or one-time gains) and/or weak forward guidance.
Weaker forward guidance does appear to be an important part of these negative reactions. Chart 5 shows the guidance cuts spiking this quarter, while Chart 6 shows the guidance raises have become less common this quarter.
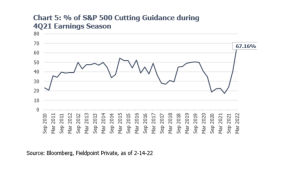
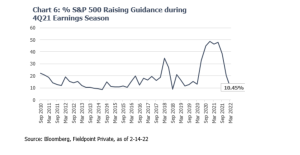
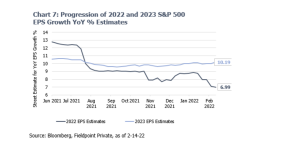
This weaker forward guidance is leading analysts to trim their expectations for 2022 EPS growth (at +7% today vs. expectations for +13% growth as of last June). Notably, analysts are not yet trimming their 2023 estimates for EPS growth (Chart 7).
The takeaway from this analysis is that earnings are still strong, but the momentum for growth and upside surprises is fading. We expect this to translate to lower equity returns this year.
We Feel Miles Apart: Earnings and Returns by Sectors
For now, we have been talking about the S&P 500 broadly, but let’s look at earnings trends and returns in individual sectors.
Table 1 shows the percentage of beats, meets and misses by sector. This earnings season, there have been stronger sectors than others (such as Health Care vs. Materials), but this has not necessarily translated into better or worse sector returns. Unsurprisingly, instead of last quarter’s earnings, sector returns are being driven by forward looking factors like how rising interest rates and commodity prices will impact future earnings.
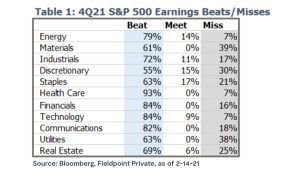
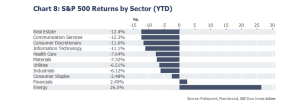
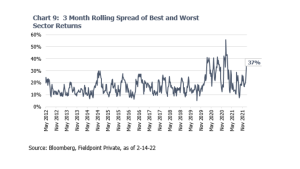
Chart 8 shows the wide dispersion of returns YTD, with a 37% spread between the best sector (Energy) compared to the worst sector (Real Estate).
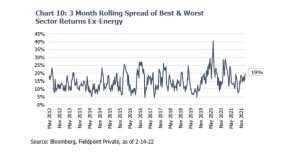
37% seems like a big spread between winners and losers, but how does this kind of dispersion stack up to history? Chart 9 shows that this degree of sector performance dispersion is elevated vs. history. However, much of this elevated dispersion in recent years can be explained by the wild swings in the Energy sector alone, so in Chart 10 we remove the Energy sector to show that the rest of the S&P is experiencing a fairly average amount of dispersion in returns (meaning most everything is down YTD).
Conclusion
The overall take away from today’s analysis is that earnings upside surprises and growth have been strong drivers of equity returns over the past two years, but that these two earnings factors are likely to become a fading source of upside for equity markets in 2022.
This means that there will be less cushion for earnings growth to offset P/E multiple compression, which we expect to continue as the Fed moves to tighten monetary policy and withdraw liquidity. The combination of lower EPS growth and falling multiples is expected to result in much lower equity returns in 2022 than what we have experienced in 2019-2021.
Please note, this does not mean there isn’t opportunity within this market. The next step in this work will be to look at where we are likely to see stronger and weaker sector returns through the remainder of 2022. This is a helpful analysis, not only to assist in choosing investments out of strong sector groups, but also gauging overall risk appetite within the market.
Stay tuned for next week (and in the meantime, sing your heart out)!
IMPORTANT LEGAL INFORMATION
This material is for informational purposes only and is not intended to be an offer or solicitation to purchase or sell any security or to employ a specific investment strategy. It is intended solely for the information of those to whom it is distributed by Fieldpoint Private. No part of this material may be reproduced or retransmitted in any manner without prior written permission of Fieldpoint Private. Fieldpoint Private does not represent, warrant or guarantee that this material is accurate, complete or suitable for any purpose and it should not be used as the sole basis for investment decisions. The information used in preparing these materials may have been obtained from public sources. Fieldpoint Private assumes no responsibility for independent verification of such information and has relied on such information being complete and accurate in all material respects. Fieldpoint Private assumes no obligation to update or otherwise revise these materials. This material does not contain all of the information that a prospective investor may wish to consider and is not to be relied upon or used in substitution for the exercise of independent judgment. To the extent such information includes estimates and forecasts of future financial performance it may have been obtained from public or third-party sources. We have assumed that such estimates and forecasts have been reasonably prepared on bases reflecting the best currently available estimates and judgments of such sources or represent reasonable estimates. Any pricing or valuation of securities or other assets contained in this material is as of the date provided, as prices fluctuate on a daily basis. Past performance is not a guarantee of future results. Fieldpoint Private does not provide legal or tax advice. Nothing contained herein should be construed as tax, accounting or legal advice. Prior to investing you should consult your accounting, tax, and legal advisors to understand the implications of such an investment.
Fieldpoint Private Securities, LLC is a wholly-owned subsidiary of Fieldpoint Private Bank & Trust (the “Bank”). Wealth management, securities brokerage and investment advisory services offered by Fieldpoint Private Securities, LLC and/or any non-deposit investment products that ultimately may be acquired as a result of the Bank’s investment advisory services:
Such services are not deposits or other obligations of the Bank:

− Are not insured or guaranteed by the FDIC, any agency of the US or the Bank
− Are not a condition to the provision or term of any banking service or activity
− May be purchased from any agent or company and the member’s choice will not affect current or future credit decisions, and
− Involve investment risk, including possible loss of principal or loss of value.
© 2022 Fieldpoint Private
Banking Services: Fieldpoint Private Bank & Trust. Member FDIC.
Registered Investment Advisor: Fieldpoint Private Securities, LLC is an SEC Registered Investment Advisor and Broker Dealer. Member FINRA, MSRB and SIPC.
Cameron Dawson
CFA®,
Chief Market
Strategist