We’re Here for a Good Time, Not a Long Time: Lessons from the Teens on Cyclicals

After a dormant summer, we think investors could get another chance at cyclical outperformance. But buyer beware, this outperformance could be relatively short-lived as the economic and monetary policy cycle progresses. So as we often say with cyclical investing: we’re here for a good time, not a long time.
In today’s note we cover:
- The cyclical response to today’s taper talk
- 2013’s market dynamics
- 2014’s dollar rally and the industrial recession
- Today’s playbook in cyclicals
- Tech’s role in portfolios and markets
- What to do
Cyclicals Love Taper Talk
Last week the Fed indicated that an announcement for the start of tapering the $120B/month of quantitative easing asset purchases could come soon (if that sounded like the most non-committal sentence to you, you are not alone).
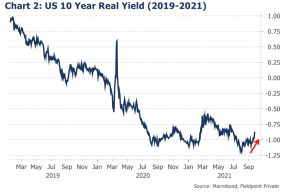
Markets reacted by sending long bond yields higher on both a nominal and real basis (the real yield is the nominal yield minus inflation; real yields have been deeply negative since the pandemic given very loose policy, long- and short-term macro-dynamics and technical factors keeping nominal yields low despite high inflation readings).
Chart 1 shows how the nominal yield on the 10 Year Treasury has now broken above important resistance from 2012, 2016 and 2019 lows, with a zoom in on recent trading.
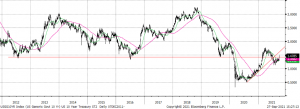
Chart 1: US 10 Year Treasury Yield Breaks Above 2012, 2016 and 2019 Lows
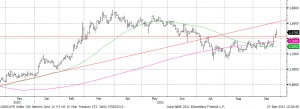
Source: Bloomberg, Fieldpoint Private
Chart 2 shows the jump in real yields off of deeply negative levels. It remains to be seen if this will continue, but as we will see, any movement higher in real yields has important implications on equity leadership.
Equity markets responded to this jump in yields by bidding up cyclical sectors like Financials, Energy, and Consumer Discretionary and selling yield-sensitive defensive sectors like Real Estate, Utilities, and Consumer Staples. Table 1 shows this performance.
Table 1: Cyclicals Outperform Defensives Last Week
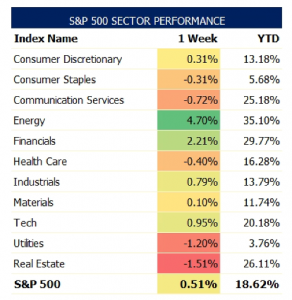
Source: Bloomberg, Fieldpoint Private, as of 9/24/21
Back to the Teens
For all of the communication pains that the Fed has had to go through to assure markets that we are not going to have a repeat of the 2013 Taper Tantrum, there are similarities to the market response that are important for today’s playbook.
For background, here is a very helpful timeline about the Taper Tantrum from Reuters.
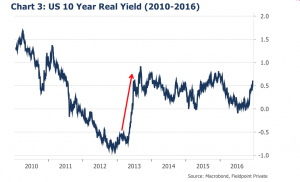
Following the spring 2013 Fed policy meetings and congressional testimonies that indicated a tapering of bond purchases was coming soon, yields rocketed higher (bond prices fell). Chart 3 shows how in 2013 real yields staged a significant bounce coming off of deeply negative levels (sound familiar?).
Equity markets experienced some short-term volatility, with the S&P 500 trading down about 8% in May/June 2013, only to bounce back quickly and resume its strong uptrend (the dual losses in bond and equity prices is what made the Tantrum period so scarring for investors). But more importantly, leadership in the S&P 500 shifted under the surface.
Just like last week, the jump in yields catalyzed a rally in cyclical assets. Industrials were the key leader coming out of the Tantrum, with Materials, Energy, and Financials putting up a solid performance. Defensive areas like Staples and Utilities, which had led to start 2013, started to underperform sharply.
But this didn’t last forever.
Cyclicals only outperformed until the Fed actually kicked off its taper process in early 2014. And from there, things got a bit messy.
2014: We’re Not All in This Together
The relationships between currencies, yields, monetary policy, and fiscal policy are not static.
For example, a loose monetary policy in the U.S. does not necessarily mean a weak USD. Any one currency is priced relative to other currencies, so the path of the USD also depends, in part, on what other central banks are doing.
2014 was a year of divergent monetary policy. While the U.S. Fed was tightening liquidity through its tapering of bond purchases, the European Central Bank (ECB) went the opposite direction by loosening policy significantly. The Bank of Japan (BOJ) also surprised markets by loosening policy in 2014.
The end result of this divergence? A huge 26% USD rally starting in June of 2014 (see Chart 4).
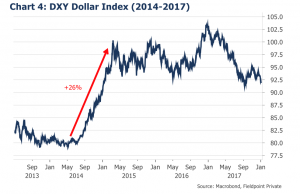
This dollar rally had profound implications on markets and business activity through the next 18 months.
The start of the USD rally caused a crack in oil prices. Oil slid from a peak of $108 in June of 2014 all the way down to $26 in January of 2016 (magnified by the game of chicken between OPEC and U.S. onshore drillers).
This drop in oil prices set off the “Industrial Recession”, where U.S. manufacturing, which had become heavily dependent on selling into the U.S. fracking boom, ground to a halt. The corruption crackdown and policy tightening out of China added an extra layer of pain for global cyclicals.
Many blue-chip cyclical stocks saw drawdowns in excess of 40% as earnings estimates were continuously cut for 18 months (eventually becoming an incredible buying opportunity for those who didn’t believe it was the end of the world).
Eventually, the Fed had to back off of its tightening plans, with the bottom in the cyclical stocks and top in the dollar being put in place when then Fed Chair Janet Yellen indicated that the Fed would not hike rates three times as previously planned in 2016.
This experience of 2014-2016 displays just how important relative monetary policy, and thus the USD, is for sector leadership within the global equity markets.
Today’s Playbook: Seasonality and Selectivity
As we mentioned at the start, we are seeing signs of life in cyclicals (Energy, Financials, Discretionary, Industrials, and Materials) along with the jump in yields.
This is consistent with typical seasonality for cyclicals. “Sell in May and go away” may have mixed results for the market overall, but for the most cyclical sectors, it can be more alpha impactful. The best seasonal period for cyclicals is October-April (there is also seasonality to yields, with yield declines through the summer and yield rebounds through the remainder of the year).
A cyclical bounce is also consistent with the bottoming we are seeing in economic surprises (Chart 5). When economic surprises reach lows, it can be a contrarian buying indicator for those areas that have the most beta (or sensitivity) to economic growth, meaning the cyclicals.
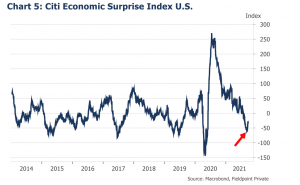
We are not inclined to “blindly” buy this bottom in economic surprises because we haven’t seen the fall in economic surprises result in major cuts to earnings estimates. This means that the bar is still very high for beats going into the 3Q21 earnings season.
As we have seen in weak trading following the recent off-cycle earnings reports (FDX, NKE, etc.), there is little tolerance for misses or caution given the combination of high expectations and high valuations. The ability to defend margins and deliver on-demand in an inflationary and disrupted supply chain environment will certainly “separate the men from the boys” this earnings season.
As is typical as we move later in the economic cycle, selectivity is key.
But What About Tech?
You may have noticed that we have not mentioned Information Technology in our cyclical vs. defensive discussion yet, and this is because tech’s role in portfolios has changed.
Once lumped with the cyclical sectors because of its sensitivity to corporate IT capex, Tech’s shift to more services, recurring revenue, and platform businesses has made the sector a defensive hide out.
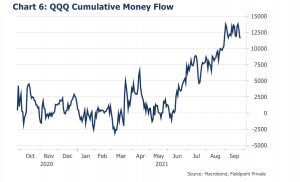
We could see this defensive dynamic this summer with huge inflows into the NASDAQ-100 as growth fears took hold and real yields fell again (Chart 6).
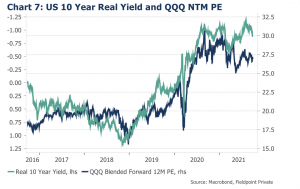
Tech/growth valuations and relative performance have been tightly linked to the direction of real yields (Chart 7). When real yields have plunged, tech valuations have soared and growth has significantly outperformed value, but when real yields have climbed these fortunes have been reversed.
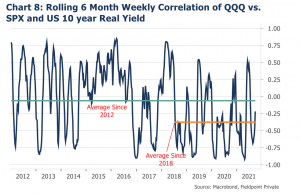
For those deep divers out there: To capture this evolution of tech’s role in portfolios we calculated the rolling 6-month correlation of the NASDAQ-100 QQQ’s relative performance to the S&P 500 with real yields. Chart 8 is volatile and oscillating but shows that since 2011 these two have been somewhat negatively correlated, as expected (falling real yields means better QQQ performance). What’s interesting is that since 2018 this negative correlation has become more pronounced, meaning that a fall in real yields is more linked to outperformance by tech. What happened in 2018? The “Powell Pivot” of course, where Powell backed off of tightening policy and turned to interest rate cuts due to the threat of yield curve inversion. This policy shift resulted in an explosion in tech/long-duration valuations.
Tech/growth’s big weight rally this summer buoyed the overall index, creating the much-discussed drop in breadth and a market that could be near all-time highs while over 40% of its members were down >10%.
But with tech almost 30% of the S&P 500, the fate of the sector and the cap-weighted index are linked.
We’re Here for a Good Time, Not a Long Time
Last week’s equity performance shows the merit of a balanced equity portfolio between Growth and Value (which is not a proxy for cyclicality but has overlap) in today’s market environment.
We think cyclicals have a window for outperformance going into the last quarter of 2021 but don’t expect a rising tide to lift all boats like it did last fall. The bar is high for surprises to the upside, unlike last year when cyclical estimates were blown out.
This cyclical rebound could be relatively short-lived depending on the path of the dollar once tapering formally kicks off (like it was in 2013). It will be imperative to watch how the market judges the relative monetary policy between the US and other major countries (mainly Europe and Japan) to get a sense of the direction of the USD.
The last bit of good news for cyclicals, and one that deserves an update of its own, is that inventory restocking has the potential to lengthen this manufacturing cycle. As workers reenter the labor force and supply chain delays get cleared, inventories, which are near record lows, will need to be restocked. This has the potential to keep activity elevated through 2022, but more on that in the coming weeks.
Disclosures
IMPORTANT LEGAL INFORMATION
This material is for informational purposes only and is not intended to be an offer or solicitation to purchase or sell any security or to employ a specific investment strategy. It is intended solely for the information of those to whom it is distributed by Fieldpoint Private. No part of this material may be reproduced or retransmitted in any manner without prior written permission of Fieldpoint Private. Fieldpoint Private does not represent, warrant or guarantee that this material is accurate, complete or suitable for any purpose and it should not be used as the sole basis for investment decisions. The information used in preparing these materials may have been obtained from public sources. Fieldpoint Private assumes no responsibility for independent verification of such information and has relied on such information being complete and accurate in all material respects. Fieldpoint Private assumes no obligation to update or otherwise revise these materials. This material does not contain all of the information that a prospective investor may wish to consider and is not to be relied upon or used in substitution for the exercise of independent judgment. To the extent such information includes estimates and forecasts of future financial performance it may have been obtained from public or third-party sources. We have assumed that such estimates and forecasts have been reasonably prepared on bases reflecting the best currently available estimates and judgments of such sources or represent reasonable estimates. Any pricing or valuation of securities or other assets contained in this material is as of the date provided, as prices fluctuate on a daily basis. Past performance is not a guarantee of future results. Fieldpoint Private does not provide legal or tax advice. Nothing contained herein should be construed as tax, accounting or legal advice. Prior to investing you should consult your accounting, tax, and legal advisors to understand the implications of such an investment.
Fieldpoint Private Securities, LLC is a wholly-owned subsidiary of Fieldpoint Private Bank & Trust (the “Bank”). Wealth management, securities brokerage and investment advisory services offered by Fieldpoint Private Securities, LLC and/or any non-deposit investment products that ultimately may be acquired as a result of the Bank’s investment advisory services:
Such services are not deposits or other obligations of the Bank:

− Are not insured or guaranteed by the FDIC, any agency of the US or the Bank
− Are not a condition to the provision or term of any banking service or activity
− May be purchased from any agent or company and the member’s choice will not affect current or future credit decisions, and
− Involve investment risk, including possible loss of principal or loss of value.
© 2021 Fieldpoint Private
Banking Services: Fieldpoint Private Bank & Trust. Member FDIC.
Registered Investment Advisor: Fieldpoint Private Securities, LLC is an SEC Registered Investment Advisor and Broker Dealer. Member FINRA, MSRB and SIPC.
