
Weekly Perspective: Broken Records and Chicken

See below for your Monday Morning Update from the Fieldpoint CIO Office. Here are the contents so you can focus on what is most relevant to you:
-
- Weekly Perspective: Broken Records and Chicken
- Last Week Market Summary: Equities New Highs, 10 Year Above 1%, Industrial and Energy Commodity Rally
- Last Week Data Summary: Jobs and PMIs
- This Week Data
- International Focus: Rallies Abound, Emerging Markets Lead
At the risk of sounding like a broken record, we continue to be struck by the degree of extreme bullish sentiment, notably from retail, during the recent market advance. Risk asset prices moving higher in a parabolic, nearly vertical manner, surges in small-trader bullish call option volumes, and continued 90 percentile-plus readings in sentiment surveys (ex. AAII), all serve to indicate that bubbly conditions are percolating in some of the riskiest areas of the market. Here is a round-up of some of the most striking observations (many of which were noted in this Bloomberg article, which is worth a read):
- Bullish call option volume is surging
- The rally last Wednesday was the fourth busiest day ever for call option volume (the top three were all in 2020)
- Option trading has now become dominated by small traders, similar to 2000 (see Chart 1 and Chart 2
- With this heavy use of options and increasing margin loan balances, retail traders are increasing their leverage
- Absolute margin loans have reached an all-time high (as of November 2020, the most recent FINRA data); there is debate as to how to interpret this, with bulls noting that margin loans remain off of the 2000’s peak as a % of market cap (but that observation is reflexive)
- Another way to look at this is the growth in margin loan balances, which is up 50% in the 8-months to November, which is near the peak growth level seen in March 2000 and June 2007 (see Chart 3)
- Tesla, which saw a 25% rally in its stock price last week alone (following a 740% rally in 2020), saw the price for call options with a $1,000 strike and January 15 expiration quintuple last week (“hey, investing is easy!”)
- The NASDAQ 100 has doubled in two years
- New entrants into the market are emboldened by strong returns in 2020. There is a loudening chorus of “get rich quick” evangelists encouraging followers to multiply stimulus checks by investing in the stock market. A few minutes (or for us a startling afternoon going down the rabbit hole) on Reddit, Twitter, and now TikTok shows the proliferation of this multiplicative promise. Take for example, the TikToker shown in this article, explaining to followers how to quickly turn the $600 “stimmy” check into $13k…
- Following it’s 270% rally in 2020, Bitcoin was up +33% last week alone; the source of the rally has wide interpretation: some view BTC price action as a function of excess market liquidity and risk sentiment, while others see it as an expression of investors desire for a restricted supply, inflation impervious asset in a world of higher deficits (see here), while others see it as a “call option on human nature” (see here).
We again note that these sentiment measures are weak market timing tools, as bullish sentiment extremes can both persist and intensify for an extended period of time. However they must not be shrugged off, because as they intensify, the risk they pose to the market rises: they create a “higher bar” for surprises and positioning to drive market upside and they increase the risk that, in an eventual correction, the unwind of the bullish extreme will serve to amplify the downside (leverage cuts both ways).
We tie these bullish extremes and the rapid asset price inflation back to the continuation of extraordinary Fed liquidity support, even as economic activity recovers and fiscal stimulus (which adds to liquidity as well) is increased. This excess liquidity allows sentiment extremes to persist and intensify, so it raises the question: as signs of intrepid risk taking escalate and asset prices reach new heights, will the Fed “blink” in this game of chicken and move to reduce accommodation?
Given Fed commentary, it does not seem likely that it will be asset prices that get the Fed to tighten. There is only a small voice within the Fed concerned by current asset price movements and risks to future financial stability, while Fed Chair Powell seems highly inclined to find ways to justify current valuations, as we described in our December 21, 2020 update “The Fisher Fed”. Last week, Fed Vice Chair Clarida even stated, when asked about potential risks of an equity bubble, that “It’s not something that sitting here today is a particular concern” (see article here).
The Fed isn’t just standing pat on its accommodation path in the face of extreme sentiment signals, but also with rebounding economic activity indicators. We provide detail on the U.S. manufacturing PMI below, but note that at December’s highly expansionary reading of 60.7, we would typically expect forward returns in the market to be quite poor. This is because at readings above 60 usually the Fed is moving to remove accommodation from a hot economy, so 2-Year yields would be moving higher and valuations would be coming under pressure. As we continue to note, 2-Year yields aren’t moving at all, despite higher growth and inflation expectations. Of course the Fed has air cover to remain easy given continued elevated unemployment and sub-2% observed inflation (as measured by the Core PCE), but the contrasting PMI and asset price strength exemplifies the Fed’s intention to let the economy “run hot”.
Thus, the game of chicken continues, but the stakes are growing ever higher.
Chart 1: Call Option Buying by Small Traders Surging Higher
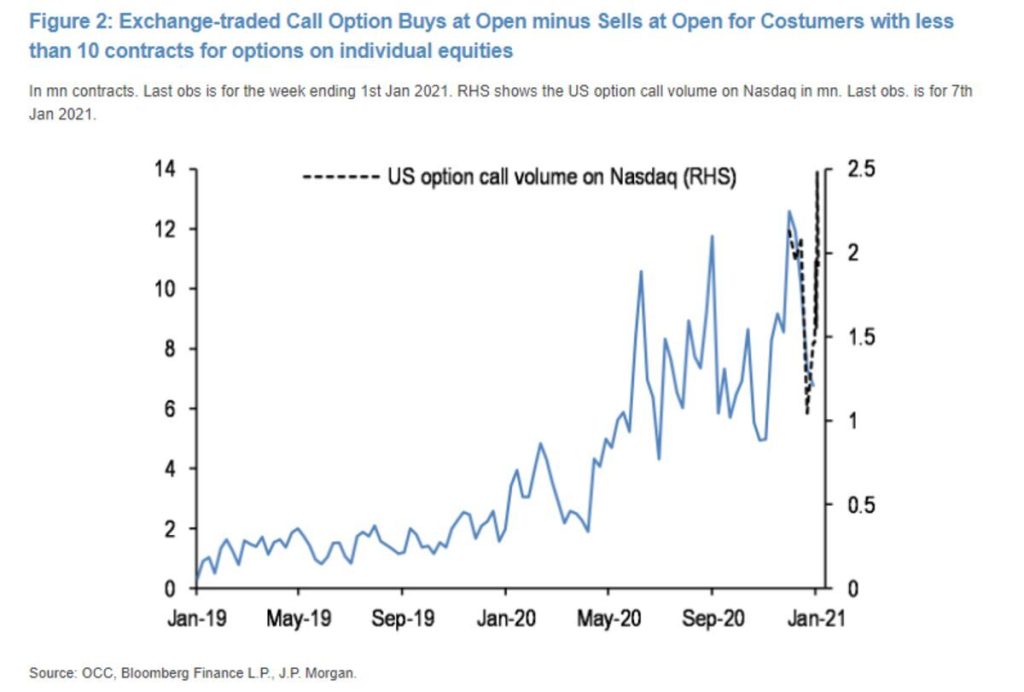
Chart 2: Small Traders are Now Over 40% of all Call Purchases, Not Seen Since 2000

Chart 3: Growth in Margin Debt Balances of 50%, Highest Since 2000 and 2007

Last Week in Markets: Equities New Highs, 10 Year Above 1%, Industrial and Energy Commodity Rally
Equity markets started 2021 with a decidedly positive, risk-on, cyclical tone. Despite a turbulent week of news, markets focused on the positives and interpreted negatives as catalysts for further market support. The Democrats winning both Senate seats in the Georgia run-off, resulting in majorities (be they slim) in both the House and Senate, gave investors confidence that further fiscal stimulus could be enacted; while the weak December jobs number gave U.S. equity markets the optimism that this stimulus would be enacted. The prospect for more fiscal stimulus is seen as most supportive for cyclical names and those in the most precarious financial positions, as both these cohorts have the most to gain from a snap back in economic activity, given they were some of the hardest hit by 2020’s economic shock. Add on top of this the expected weakening of the dollar, steepening of the yield curve and increasing commodity prices that could come along with higher U.S. deficient spending, and the character of this rotation trade takes shape.
Equities
US large cap equity indices rallied to new highs last week (S&P 500 +1.83%, NASDAQ +2.43%, Dow Jones Industrial +1.61%), but it was the smaller cap sizes that stole the show. After a soft end to 2020, mid caps (+4.76%) and small caps (+5.91%) roared back in the first week of 2021. Growth (+1.22%) underperformed Value (+2.86%). Sector performance had a clear, risk-on, cyclical tone. Laggards were the most defensive areas (Real Estate -2.55%, Consumer Staples -0.98%, Utilities -0.65%, and Communication Services -0.27%), while some of the most cyclical areas staged impressive rallies (Energy +9.31%, Materials +5.68%, Financials +4.65%, Consumer Discretionary +3.84%). Interestingly, Technology (+0.43%) and Industrials (+1.1%) saw more muted performance. One cyclical vs. defensive indicator also supported this risk-on tone, with cyclical semi-conductors (+5.04%) massively outperforming defensive software (-1.2%). The source of the Financials (Banks rallied +7.65% last week!) and Energy outperformance can be tied to movements in yields and commodities as discussed below.
Yields: 10 Year Past 1%, 2 Year Unmoving
On the back of expectations for more fiscal stimulus given Democratic control of both the Legislative and Executive branch, longer dated U.S. Treasury bond prices sold off as yields pushed higher (yield and price move in opposite directions). 10-Year yields surpassed the much-watched 1% level (+20 bps on the week to 1.12%, see Chart 4). Though many interpreted this move as the “reflation” trade (WSJ, FT), interestingly the rise in inflation expectations was more muted, up by only +2 bps to ~2% (5Y5Y Forward Inflation Expectations). This possibly indicates that, in addition to expectations for higher inflation, a “fiscal risk premium” is getting reflected in longer dated yields, as Treasury market investors begin to contemplate a future of larger fiscal deficits and sustained higher Treasury issuance. Thus, the 10-Year real yield also pushed higher last week given the rise in nominal yields was greater than the increase in inflation expectations(Real = Nominal – Inflation), but it remains deeply negative (see Chart 5).
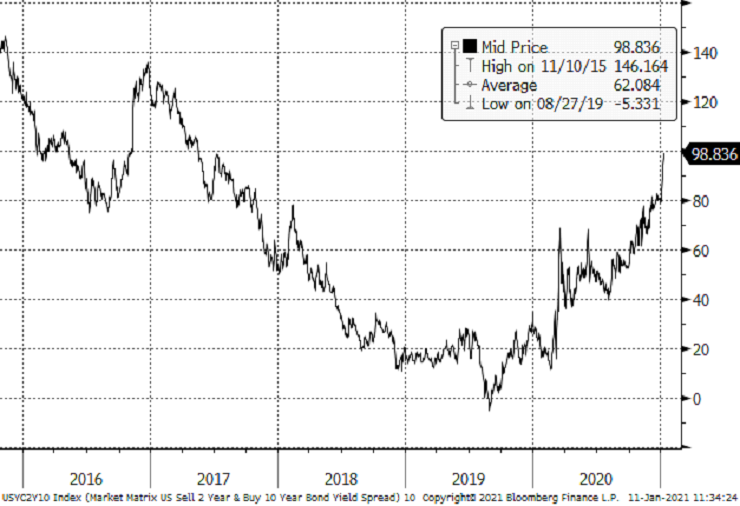
Yet again, the 2-Year yield was little changed last week (+1 bps to 0.13%, see Chart 6), thanks to Fed intervention and investors continuing to expect the Fed to remain highly accommodative and easy, even if fiscal stimulus is stepped up. Currently both the signals from Fed officials and Fed Funds Futures markets don’t see the Fed raising rates until 2023 (see Bloomberg article here for a roundup of central bank outlooks). This non-moving 2-Year and a push higher in the 10-Year led to further steepening of the yield curve to the highest levels since 2017, driving Bank outperformance (see Chart 7).
Chart 4: 10-Year Nominal Yields Broke Above 1% and Push Higher
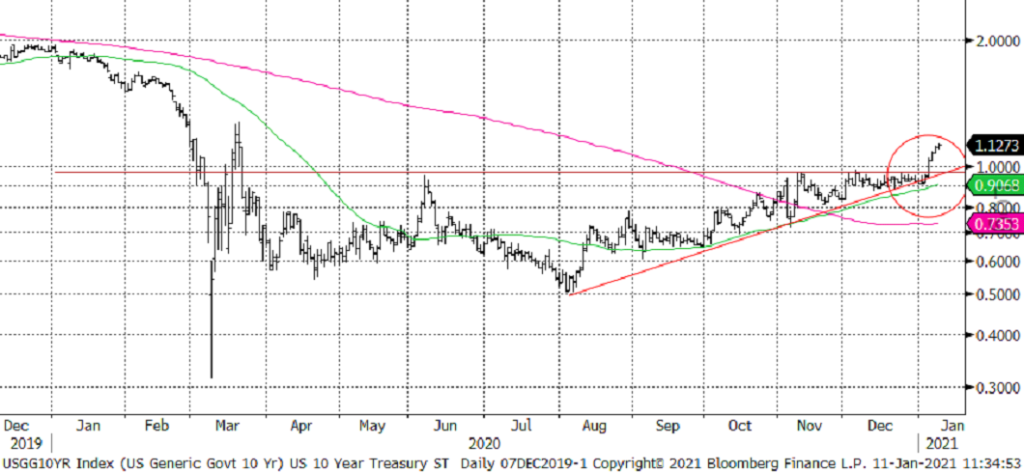
Chart 5: 10-Year Real Yields Move Higher But Remain Very Negative
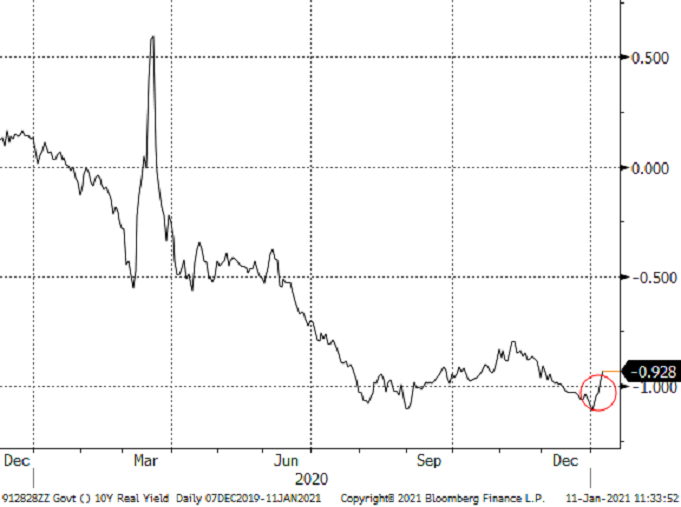
Chart 6: Still No Movement in 2-Year Yield

Chart 7: Steepening of the 10-2 Yield Curve (good for banks)
Credit Spreads
We note that despite the rise in interest rates, price indices on credit were actually positive on the week given the expectations for improved U.S. economic growth (HYG price +0.08%). High Yield credit spreads moved to pre-pandemic lows last week (recall the absolute yield on High Yield debt reached all-time lows at the end of 2020). Similarly, muni prices held up last week, notably for high yield issuers, thanks to expectations for greater state and local fiscal support.
Dollar
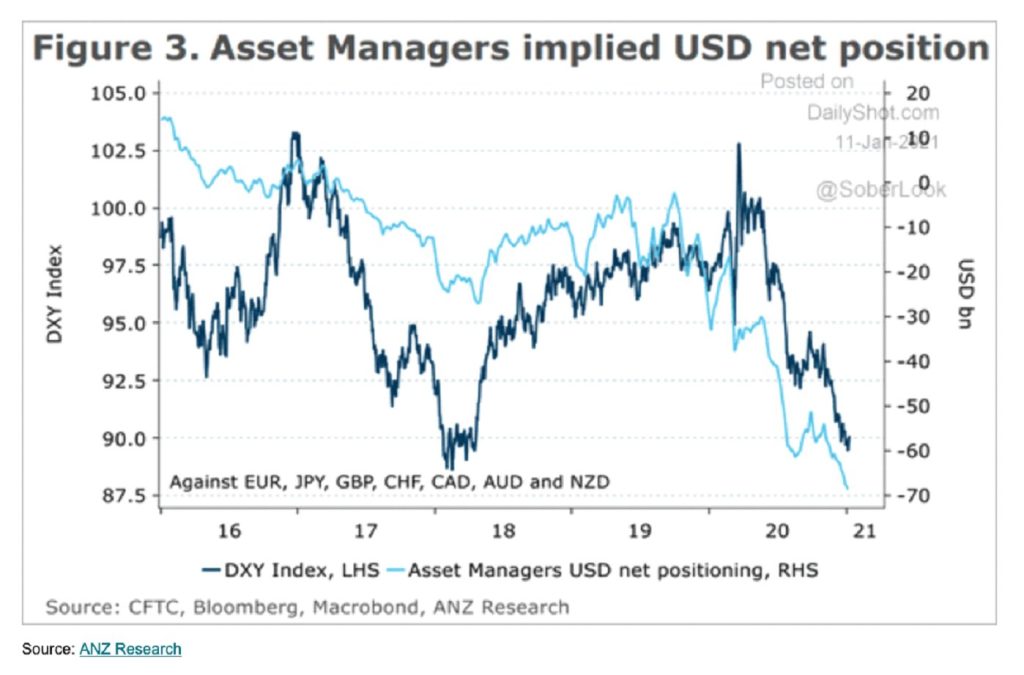
The U.S. Dollar rose modestly last week (DXY +0.13%), and remains near critical long term support. We have noted that a short term bounce off of this key support level is possible, while a break below would signal more pronounced dollar weakness to come. One key impediment to a weaker dollar is how consensus calls and positioning for a weaker dollar have become. The next two charts (Chart 8 and Chart 9), sourced via The Daily Shot, show the extent of bearish positioning in the dollar, while this article (a great piece from Reuters looking at Wall Street’s expectations for 2021) and this article (a fun graphic from Visual Capitalist) highlight how consensus the call for a weaker dollar has become.
The other watch item for the USD is the level of yields. Some analysts see higher yields on the longer end of the curve, such as the 10-Year, drawing in global buyers and thus increasing demand for dollars (with U.S. Treasuries offering a higher yield than other developed countries). Others argue that nominal yields aren’t relevant for this flow of funds, noting that real yields in the U.S. remain very low, with much less difference between U.S. real yields and other developed real yields, implying that there isn’t the impetus for investors to invest in USD denominated yield assets. We’ll be watching this dynamic closely.
Chart 8: Traders are Very Short USD
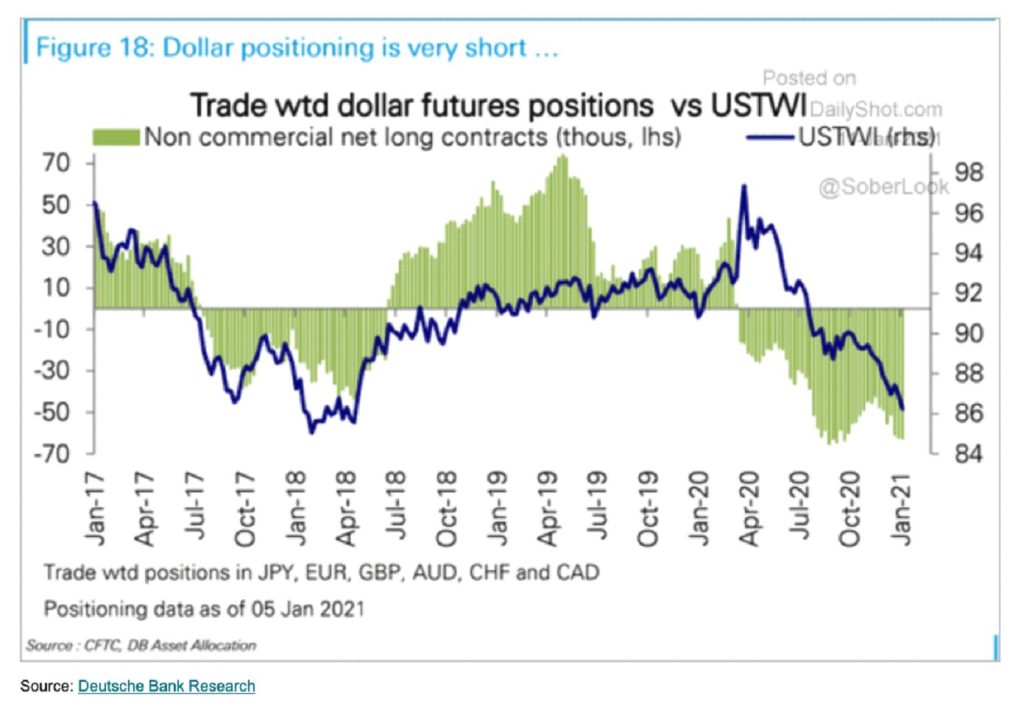
Chart 9: Asset Managers Very Short USD
Commodities
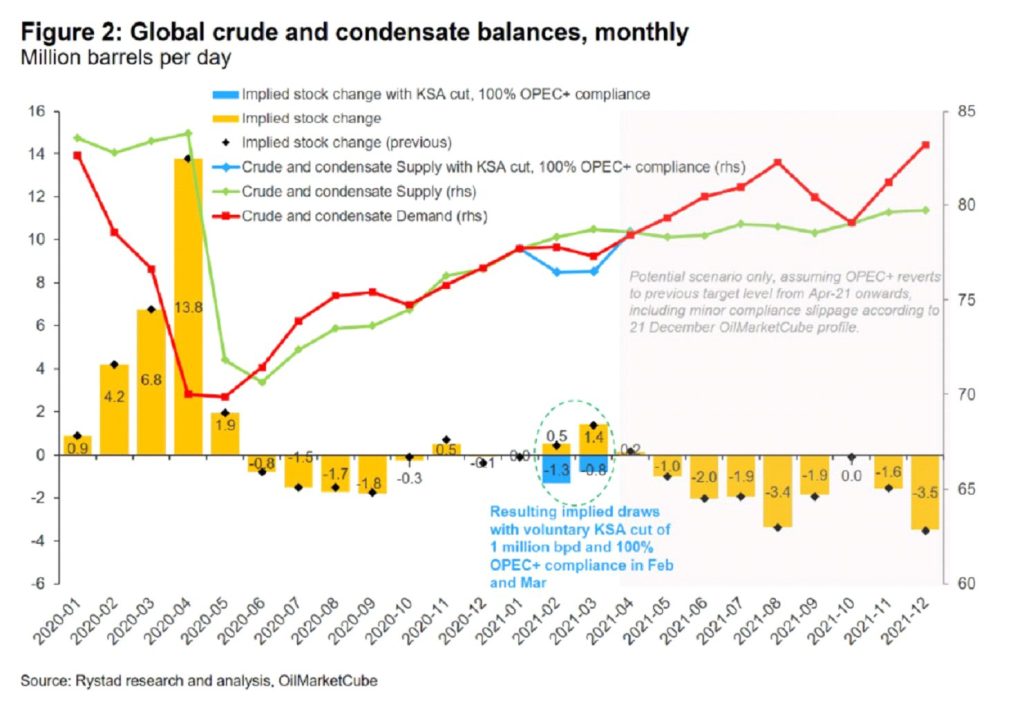
In commodities, the stronger dollar and higher yields weighed on precious metals (-4.04%), with Gold (-2.62%) and Silver (-3.07%) both weaker. Industrial metals (+3.74%) continued to outperform precious metals, another key pro-cyclical indicator (Copper +4.39%, Iron +5.3%). Crude prices rallied sharply (WTI +7.6% to $52.24 and Brent +8.09% to $55.99) after Saudi Arabia announced a surprise unilateral cut of 1 million barrels per day for oil production. This cut could bring the oil market into deficit by March (demand exceeding supply, leading to inventory drawdowns), even as demand remains impaired, though improving, from the pandemic (see article here, which includes Chart 10 that shows the projected oil market deficits for 2021 from Goldman Sachs and Chart 11 that shows supply and demand balance from Rystad).
Chart 10: Goldman Sachs Projections for Global Oil Market Balances
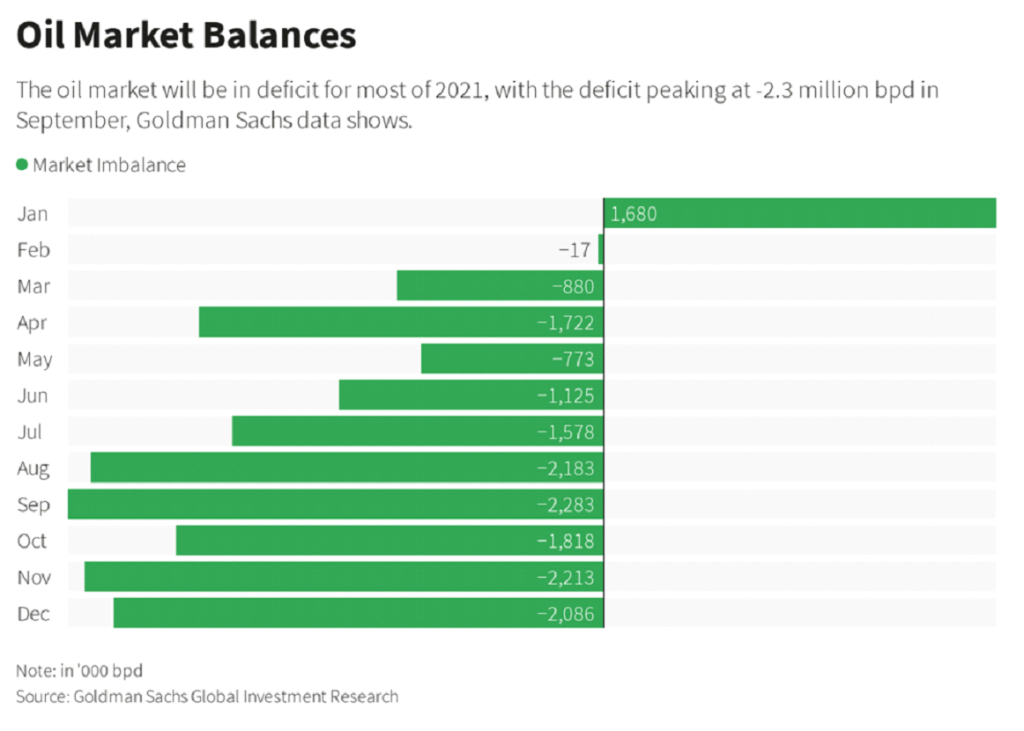
Chart 11: Global Crude and Condensate Balance from Rystad Research
Last Week Economic Data: PMIs
Jobs
Friday’s Nonfarm Payrolls jobs reported came in much weaker than expected, with an unexpected 140k drop in payrolls, the first monthly decline since April. Notably, this weakness was partially offset by an upward revision of 135k for October in November. Within the December report, Leisure and Hospitality saw the largest drop in payrolls (down almost 500k) due to renewed lockdowns and virus restrictions. Education was also weak at -31k. On the upside, Professional and Business Services, Retail, Construction, Transportation & Warehouse, Manufacturing, and more all saw employment increases in December (see article here and Chart 12).
Chart 12: December Jobs By Industry

PMIs
The U.S. ISM Manufacturing Purchasing Manager Index, a measure of manufacturing activity, surprised to the upside last week (60.7 vs. 56.8 cons, readings above 50 indicate expansion and below 50 contraction). There was strength throughout the components report, with New Orders a very robust 67.9 and Employment going above 50, signaling expansion. The key driver of the upside of the report was delay in Supplier Deliveries. When Supplier Deliveries are taking longer than desired, it is considered a positive input into the PMI because it indicates that suppliers are having trouble keeping up with demand. Supplier deliveries have been delayed due to pandemic related challenges (sourcing labor, reduced capacity for safety, shipping bottlenecks, and more). There was also upside pressure on prices, with the ISM Prices Paid component clocking in at 77.6 (vs. 66 cons).
The Service sector PMI surprised to the upside as well, coming in at 57.2 (vs. 54.5 cons), the highest in three months. Though the Service report showed a similar boost due to delays in Supplier Deliveries, the Employment component of the report slipped to 48.2 in December, signaling contraction.
This Week Data:
- Monday: None
- Tuesday: Job Openings and Labor Turnover Survey (JOLTS)
- Wednesday: Consumer Price Index, Federal Budget
- Thursday: Weekly Unemployment Claims, Export/Import Prices
- Friday: Retail Sales, Business Inventories, University of Michigan Consumer Sentiment, Producer Price Index, Industrial Production and Capacity Utilization
International Focus:
International markets continued their outperformance of U.S. markets last week, with emerging markets leading the charge (EM +5.88% and EAFE Developed +3.8%).
European shares were higher (STOXX 600 +3.04%), led by 2020’s laggard, the UK (+6.39%). UK shares were bolstered by rallies in banking and mining shares. The Eurozone is still teetering on the edge of deflation, with December headline consumer prices falling -0.3% YoY and core inflation (ex food and energy) showing a +0.2% increase YoY. Likely bolstered by strong China activity (a key export destination), Germany Industrial Production (+0.9% vs. +0.7% cons) and Exports (+2.2% vs. +1% cons) both surprised to the upside.
In Asia, Korean shares staged a massive rally (+9.7%), while Japan rallied +2.5% to its highest level since 1990, but still ~28% off of the 1989 bubble high. The Japanese Prime Minister declared a state of emergency in Tokyo due to rising coronavirus infections. In China, the CSI 300 index of large cap stocks rallied +5.5% and the Shanghai Composite rallied +2.79%, despite volatile headlines around de-listings and investment blacklists.
Latin America shares saw powerful rallies with Chile +10.42%, Brazil +5.09%, and Mexico +5.97% thanks to the risk on sentiment and higher commodity prices.
Disclosures
IMPORTANT LEGAL INFORMATION
This material is for informational purposes only and is not intended to be an offer or solicitation to purchase or sell any security or to employ a specific investment strategy. It is intended solely for the information of those to whom it is distributed by Fieldpoint Private. No part of this material may be reproduced or retransmitted in any manner without prior written permission of Fieldpoint Private. Fieldpoint Private does not represent, warrant or guarantee that this material is accurate, complete or suitable for any purpose and it should not be used as the sole basis for investment decisions. The information used in preparing these materials may have been obtained from public sources. Fieldpoint Private assumes no responsibility for independent verification of such information and has relied on such information being complete and accurate in all material respects. Fieldpoint Private assumes no obligation to update or otherwise revise these materials. This material does not contain all of the information that a prospective investor may wish to consider and is not to be relied upon or used in substitution for the exercise of independent judgment. To the extent such information includes estimates and forecasts of future financial performance it may have been obtained from public or third-party sources. We have assumed that such estimates and forecasts have been reasonably prepared on bases reflecting the best currently available estimates and judgments of such sources or represent reasonable estimates. Any pricing or valuation of securities or other assets contained in this material is as of the date provided, as prices fluctuate on a daily basis. Past performance is not a guarantee of future results. Fieldpoint Private does not provide legal or tax advice. Nothing contained herein should be construed as tax, accounting or legal advice. Prior to investing you should consult your accounting, tax, and legal advisors to understand the implications of such an investment.
Fieldpoint Private Securities, LLC is a wholly-owned subsidiary of Fieldpoint Private Bank & Trust (the “Bank”). Wealth management, securities brokerage and investment advisory services offered by Fieldpoint Private Securities, LLC and/or any non-deposit investment products that ultimately may be acquired as a result of the Bank’s investment advisory services:
Such services are not deposits or other obligations of the Bank:

− Are not insured or guaranteed by the FDIC, any agency of the US or the Bank
− Are not a condition to the provision or term of any banking service or activity
− May be purchased from any agent or company and the member’s choice will not affect current or future credit decisions, and
− Involve investment risk, including possible loss of principal or loss of value.
© 2021 Fieldpoint Private
Banking Services: Fieldpoint Private Bank & Trust. Member FDIC.
Registered Investment Advisor: Fieldpoint Private Securities, LLC is an SEC Registered Investment Advisor and Broker Dealer. Member FINRA, MSRB and SIPC.
Cameron Dawson
CFA®,
Chief Market
Strategist
Johnny Gibson
CFA®, Chief Investment Officer