
In Focus: The U.S. Consumer, 2022

As 2021 enters our rear view mirror and we look ahead to the open road of 2022, there are certainly many variables to consider. With consumer spending representing nearly 70% of U.S. GDP, it’s quite evident the sizeable role consumers play in defining the trajectory of the U.S. economy.
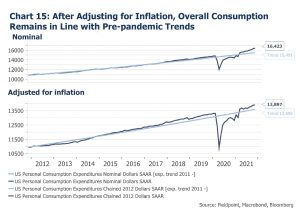
In 2021 consumer spending was a key driver for U.S. economic growth, with overall consumption levels, measured by the nominal personal consumption expenditure (PCE), persisting well above pre-pandemic trends throughout the year. However, after adjusting for inflation, real PCE has just recently reverted to pre-pandemic trends. Now, looking into 2022, can we expect real consumption to continue to remain firm in the face of continued inflation and less fiscal support for consumers? To answer this question, we put various consumer trends and metrics in focus.
Our conclusion, in short, is that after coming off an extraordinary year with an extreme demand shift from services to goods throughout 2021, we anticipate the real growth rate in overall consumption to remain at trend throughout 2022. In addition, we can expect the distribution of total consumption to normalize, in favor of services. As this heightened demand for goods begins to stabilize, we can expect supply chain shortfalls to soften, which will alleviate inflationary pressures to some degree.
Balance Sheets & Disposable Income: Despite the “curve balls” pitched by the COVID-19 crisis, U.S. consumers’ financial position appears to be robust and resilient
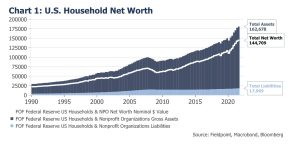
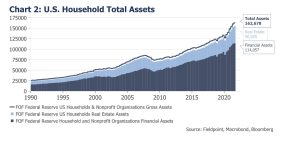
Consumer balance sheets are the strongest they have been in years. As we can see in Chart 1, overall consumer net worth is now at a new high of $145 trillion, more than double the previous high in Q3 2007. This increase is primarily attributed to the continuing climb of real estate and financial assets, which represents 25% ($40 trillion) and 70% ($114 trillion) of total assets, respectively (Chart 2).
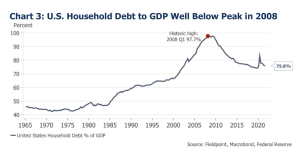
Consumer balance sheet health has been further magnified by the reduction of
leverage, with debt to income ratios now at all-time lows since the pandemic and
consumer debt as a percentage of GDP is now well below peaks last seen in 2008
(Chart 3).
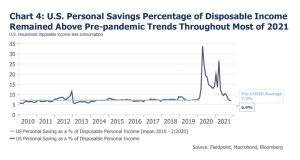
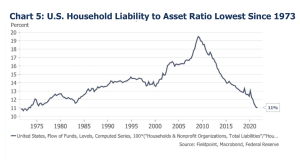
Over the past 18 months, disposable incomes rose as a result of wage growth and significant support from the federal government-through direct stimulus, temporary payment suspensions on mortgage and student loans and various generous payment deferral options. As a result, the consumer savings rate remained well above pre-pandemic trends for much of 2021 (Chart 4). This government support, paired with wage growth and an above average saving rate, allowed consumers to accumulate the most substantial balance of savings on record, bringing consumers’ total liabilities to total assets to 11%- the lowest since 1973 (Chart 5).
Fiscal Support for Consumers, What Continues in 2022
For as important as government support has been for consumers in 2020 and 2021, what is the outlook for government support in 2022? Here we run through the details of the current plans in place for 2022.
Under the American Rescue Plan Act of 2021, the Child Tax Credit provided financial aid from July to December of 2021, in the form of advanced monthly installments of up to $300 per child ages 5 and under, and up to $250 ages 6-17.
The CTC also made several sizable, yet temporary, adjustments to the 2021 credit — including increasing the amount of the credit and making it fully refundable for most taxpayers. However, with Democrats ruling out the possibility of presenting the CTC Act as a stand-alone bill, it is unclear if it the act will be extended through 2022, and if so, to what extent.
Below is a summary of pandemic related aid that has been approved for 2022:
- The Child Tax Credit Act’s final support mechanism will provide qualifying households with a boost in their 2021 tax returns. The new law will provide a one time increase in the credit from $2,000 per qualifying child to $3,000 per child ages six to seventeen, and $3,600 per child ages five and under. The credit will revert back to $2,000 per qualifying child for subsequent tax periods.
- Through the Recovery Rebate Credit program, eligible individuals who added new dependents in 2021 will be eligible to receive $1,400 per new dependent when they file their income tax returns in 2022. This is because the third Economic Impact Payment included $1,400 per eligible individual, in addition to $1,400 for each qualifying dependent in 2021, with the IRS determining the number of qualifying dependents using 2020 tax return information.
- The federal student loan repayment pause has been extended through May 1, 2022.
- COVID-19 Forbearance and Home Equity Conversion Mortgage extension programs have been extended through “the end of the COVID-19 National Emergency or September 2022, whichever is later.”
- Banks, credit card issuers and even service providers are continuing to offer COVID-19 relief through various deferral payment options for qualifying account holders.
Consumer Spending: Sub-par or “Par for the Course”?
When viewed in isolation, the November retail sales release on 12/15 was rather sub-par, reigniting debates as to whether the Omicron variant, supply constraints and/or inflationary pressures played a role in the negative surprise. While November retail sales were less than the consensus, it is worth noting that retail sales are often subject to noteworthy revisions. Nonetheless, the November report gave us some valuable insight on the consumer’s current perspective on these important factors, which we anticipate will play a critical role in consumer sentiment throughout 2022.
Here are some of the important drivers for retail sales in 2022, as revealed by recent
data:
-
- Omicron variant
Although it is possible that the Omicron variant may have an impact on future
consumer behavior, it appears to have been relatively mute with the November
retail sales data. Consumers appear to be less concerned with the variant, as
nonstore retailer sales were relatively flat for the month of November, relative to
a 1% increase month over month in restaurant sales, which are up 37% year
over year. - Supply constraints
Supply constraints persist amidst strong demand for goods. However, the robust
retail sales release for October suggests that, in preparation for potential
shipping delays and supply chain issues, consumers simply pulled a solid portion
of their holiday shopping forward. There are some early signs that supply
constraints are not getting incrementally worse. - Inflationary pressure
Growth in food and gas sales was strong in comparison to rather weak
discretionary sales, with the most noteworthy drop of 4.6% MoM in appliance
and electronics sales. This indicates that consumers could be beginning to feel the
strain brought on by ongoing inflationary pressures for large purchases.
- Omicron variant
Looking at the big picture, November’s retail sales growth was “par for the course”
considering retail sales are still well above pre-pandemic levels and October’s retail
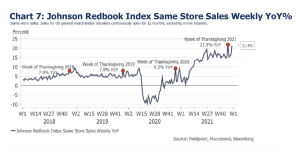
sales growth was so robust. Furthermore, other recent retail sales metrics paint a much
brighter picture. For example, MasterCard’s SpendingPulse released on Sunday, 12/26,
showed a strong jump in holiday spending. Another significant retail sales statistic: the
week of Thanksgiving was up 21% year over year (Chart 7).
All in all, 2021 retail sales have been strong, beating consensus 6 of the 11 months of
the year. However, when adjusting for inflation the growth does not appear as robust.
In November personal income grew 0.4%, while nominal personal spending rose 0.6%.
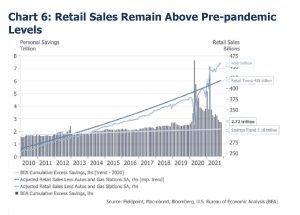
Considering inflation rose by 0.6% in November and real spending was flat, it’s clear
that inflation is beginning to pull on consumer spending, driving consumers to balance
pricing pressure with excess savings as seen in Chart 6.
The Big Shift: Demand for Goods and Services
It is rather simple to conclude that overall consumption in 2021 was extraordinary, but what were consumers buying with all of those excess savings?
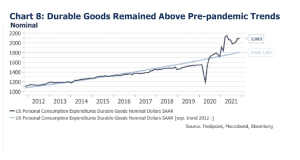
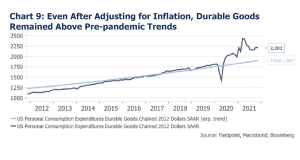
In the first half of 2021, as demand for services was curtailed by COVID-19 lockdowns, we saw a significant shift to durable goods influenced by increased disposable income and excess savings, as well as an increase in demand for bigger ticket items related to housing, autos and other areas where lockdowns spurred robust demand. The strength of the shift to goods was further magnified by consumers’ inability to spend on services due to pandemic related restrictions and lockdowns.
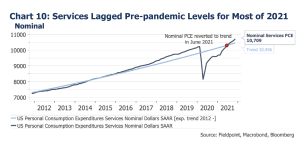
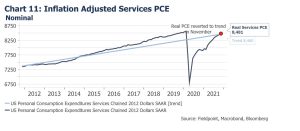
Goods remained above pre-pandemic trends throughout the entire year. We can see in Charts 8 and 9 that even after adjusting for inflation, the demand for durable goods remained solid despite supply constraints. Services, on the other hand, lagged pre-pandemic trends throughout most of 2021 with inflation-adjusted PCE finally reaching pre-pandemic trends by November month-end (Charts 10 and 11).
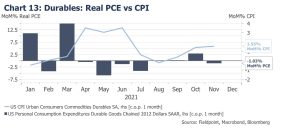
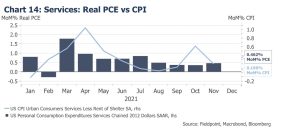
Goods had a remarkable start to the year in 2021, particularly key durables like autos and appliances (Chart 12). However, in recent months it appears that the inflation-adjusted demand for durables has started to lose its momentum in response to higher prices triggered by greater inflationary pressure and supply chain issues. In contrast, the inflation-adjusted month-over-month growth of PCE for services has been relatively stable, as inflation growth month-over-month has been less prevalent relative to goods (Charts 13 and 14).
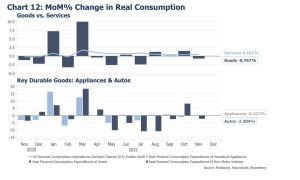
Finally, after adjusting for inflation, overall real PCE has returned to pre-pandemic levels (Chart 15), and as pricing pressures and supply constraints persist, we expect the extraordinary real demand for durables to begin to normalize as well (Chart 12). The most ideal scenario would be for real PCE for durables to remain above trend with a normalizing periodic growth rate. The downside case would be that overall demand is curtailed to trend below. Notably, a key contributor of inflation and supply chain bottlenecks has been this huge demand for goods. So, if demand does in fact normalize, over time we can expect bottlenecks to ease and inflationary pressures to cool to some degree.
Key Takeaways for 2022: Overall Normalizing From an Extraordinary 2021
In conclusion, 2021 was an extremely remarkable year for the consumer. But what can we expect as we move into the new year?
Although in some ways it feels like the pandemic is behind us, there remain a variety of COVID-19 related support structures that will provide a boost to consumers’ disposable income in the first quarters of 2022. However, as government stimulus and forbearance plans come to an end, we anticipate overall disposable income levels to stabilize. We can look to these robust consumer balance sheets as proverbial security blankets that will provide support to consumer sentiment and spending throughout the new year.
With projected normalizing income levels in the second half of 2022, we can expect consumer spending to soften to some degree, but as presented in Chart 6, we can look to consumers’ robust excess savings to uphold overall consumption levels. As supply constraints and inflationary pressures persist, we can expect the notable surge in demand for goods seen throughout Q1 and Q2 to continue to smooth, resulting in a normalized distribution of total consumer spending — in favor of service.
In Focus: Side Notes
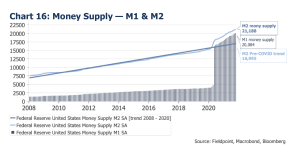
- Money supply remains at a historic high.
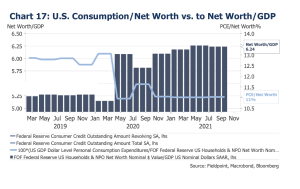
- Despite record-high levels of net worth, households have been relatively conservative with increasing their consumption relative to their net worth (as shown here with the PCE as a percentage of net worth).
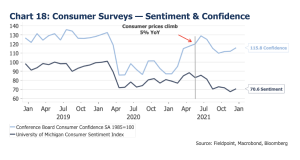
- Recent consumer confidence and sentiment surveys have just recently started to rebound after a brief dip due to surprises in inflation.
Upcoming release dates:
-
-
- University of Michigan Sentiment 1/14/2022 at 10:00 a.m.
- Conference Board Consumer Confidence 1/25/2022 at 10:00 a.m.
-
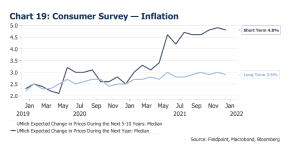
- However, consumers’ concerns about inflation appear to be short term.
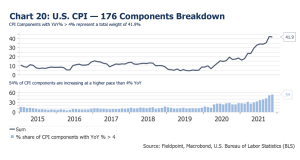
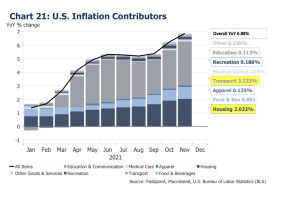
- Year-over-year inflation persists, with housing and transports at the highest contributor weights.
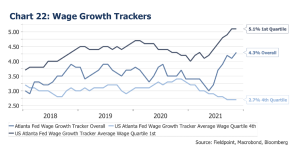
- Growing disparity in wage growth amongst top and bottom quartiles.
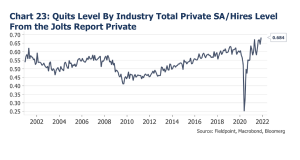
- With 4.5 million workers quitting or changing jobs in November, hiring continues to lag the number of resignations.
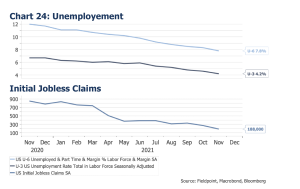
- However, unemployment and initial jobless claims continue to decline.
IMPORTANT LEGAL INFORMATION
This material is for informational purposes only and is not intended to be an offer or solicitation to purchase or sell any security or to employ a specific investment strategy. It is intended solely for the information of those to whom it is distributed by Fieldpoint Private. No part of this material may be reproduced or retransmitted in any manner without prior written permission of Fieldpoint Private. Fieldpoint Private does not represent, warrant or guarantee that this material is accurate, complete or suitable for any purpose and it should not be used as the sole basis for investment decisions. The information used in preparing these materials may have been obtained from public sources. Fieldpoint Private assumes no responsibility for independent verification of such information and has relied on such information being complete and accurate in all material respects. Fieldpoint Private assumes no obligation to update or otherwise revise these materials. This material does not contain all of the information that a prospective investor may wish to consider and is not to be relied upon or used in substitution for the exercise of independent judgment. To the extent such information includes estimates and forecasts of future financial performance it may have been obtained from public or third-party sources. We have assumed that such estimates and forecasts have been reasonably prepared on bases reflecting the best currently available estimates and judgments of such sources or represent reasonable estimates. Any pricing or valuation of securities or other assets contained in this material is as of the date provided, as prices fluctuate on a daily basis. Past performance is not a guarantee of future results. Fieldpoint Private does not provide legal or tax advice. Nothing contained herein should be construed as tax, accounting or legal advice. Prior to investing you should consult your accounting, tax, and legal advisors to understand the implications of such an investment.
Fieldpoint Private Securities, LLC is a wholly-owned subsidiary of Fieldpoint Private Bank & Trust (the “Bank”). Wealth management, securities brokerage and investment advisory services offered by Fieldpoint Private Securities, LLC and/or any non-deposit investment products that ultimately may be acquired as a result of the Bank’s investment advisory services:
Such services are not deposits or other obligations of the Bank:

− Are not insured or guaranteed by the FDIC, any agency of the US or the Bank
− Are not a condition to the provision or term of any banking service or activity
− May be purchased from any agent or company and the member’s choice will not affect current or future credit decisions, and
− Involve investment risk, including possible loss of principal or loss of value.
© 2022 Fieldpoint Private
Banking Services: Fieldpoint Private Bank & Trust. Member FDIC.
Registered Investment Advisor: Fieldpoint Private Securities, LLC is an SEC Registered Investment Advisor and Broker Dealer. Member FINRA, MSRB and SIPC.
Amanda DiSanti
Investment
Strategy
Associate