
The Implications of High Energy Prices on the Economy and Markets

Last week we wrote an update titled “Not That 70’s Show” arguing that today’s economic dynamics of elevated inflation and slowing growth were not a repeat of the 1970’s experience of stagflation (which had much higher inflation and an outright contraction in real GDP).
But it is important to reiterate that even though today’s economic environment does not fit the definition of stagflation at this time, there are still market and growth risks associated with higher inflation.
Given the recent sharp spikes in prices for oil, natural gas, and coal, we are going to look at the potential impact of higher energy prices on economies and markets.
The Cascade: How Energy Spikes Impact Economies
As we will see, energy price shocks, or rapid jumps in prices over a short period of time, have often, but not always, been associated with recessions, weaker data, and weaker markets.
One reason for this is that energy prices tend to hurt consumer spending. When energy prices rise, consumers cut spending on non-energy-related areas. The higher cost to do basic things like drive to work or heat homes eats into disposable income and reduces spending elsewhere.
Higher energy costs can also cascade through manufacturing and supply chains, driving higher costs in the rest of the economy.
We are seeing this cascading effect of the energy spike in real-time today in places like China and the UK, where the spike in energy costs has been even greater and more disruptive than in the U.S.
In the UK, we are seeing energy-intensive and low-margin manufacturers, such as fertilizer or steel, having to cut output because high energy prices have eaten away producer margins. As companies cut production, the price of the fertilizer and steel that is still being made has gone up. The next impact could be higher prices in industries that use those fertilizer and steel as inputs, like agriculture or construction.
In China, in addition to shutting low value added manufacturing, such as aluminum smelting, we are also seeing higher-margin manufacturers have to cut production because of energy rationing. Again, this is pushing up prices for the goods that are still able to be produced as the rationing exacerbates existing shortages and supply chain frictions.
We are not seeing evidence of this same cascade in the U.S. The U.S. does not have an energy shortage at this time.
That does not mean we can ignore these energy shortages in the rest of the world. Oil prices are still up materially over the last six months, partially due to being a substitute for the energy inputs, like coal and natural gas, that are in short supply in some regions.
Let’s look at prior oil price spikes and their impact on the economic markets, and given these examples, we’ll ask the question: is it different this time?
The Four Most Dangerous Words
In Figure 1, we looked at the historical change in oil prices over six-month periods since 1970. From 1970, we have identified seven periods where oil prices have spiked by over 55% in six months. You can see these price spikes have often, but not always, been associated with recessions (not necessarily caused recessions), weaker data, and weaker markets.
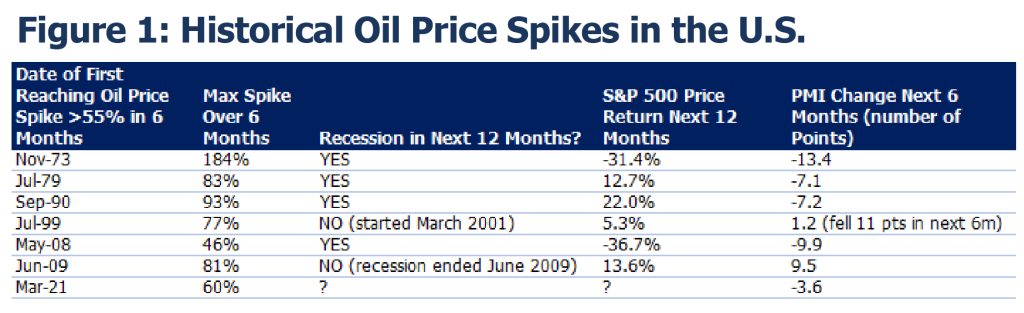
Source: Fieldpoint Private, Bloomberg
Note 1: We choose 1970 not to intentionally select more volatile data, but to show the period when oil prices became free-floating and market-based. Prior to the ’70s, oil prices were very stable thanks to being effectively negotiated by the “Seven Sisters”, the small group of private and national oil companies that controlled the global market. It wasn’t until the rise of the Gulf producers, aided by the entrance of oil commodity traders, that the oil market became “liberalized” and volatile. For a great read on this topic, check out Blas and Farchy’s The World for Sale.
Note 2: Why 55%? Since 1970, 55% is about a two standard deviation move in oil prices over a six-month period. Statistically, this means that 95% of all six-month moves in oil prices are less than 55%, making a reading greater than 55% a rare enough occurrence to be notable.
But before we start doom-extrapolating, is it wise to use these prior energy shocks as a guide for today’s economy?
Yes and no.
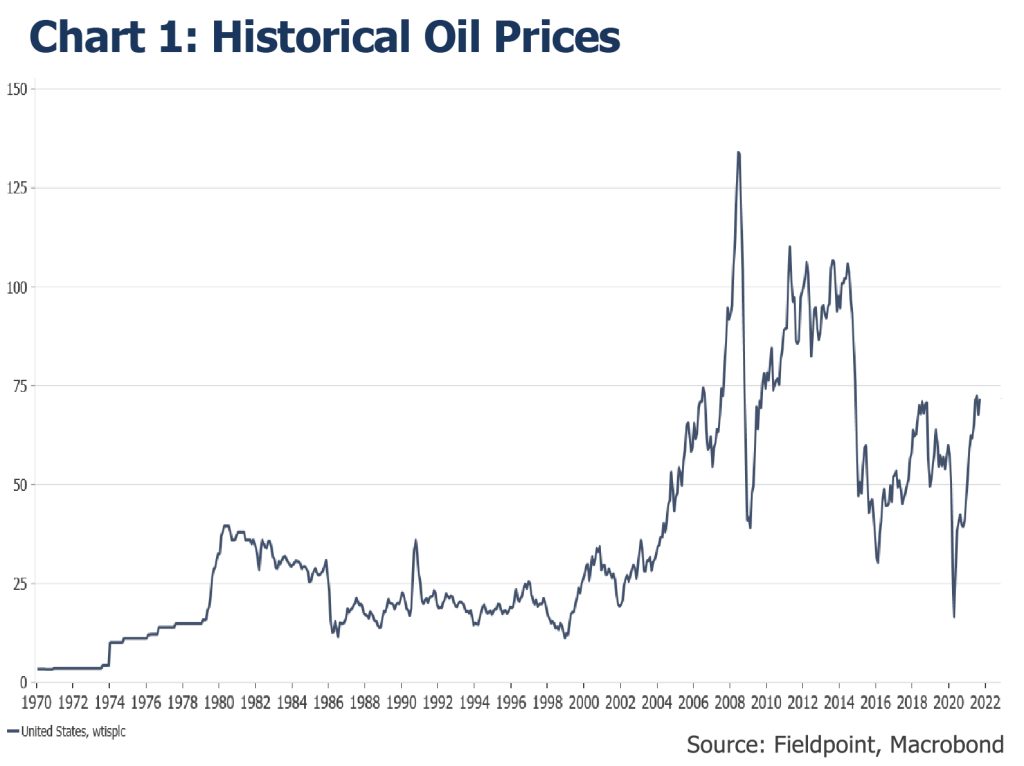
First, 2020 and 2021 have been extraordinarily unique years. Oil prices collapsed to multi-decade lows thanks to the pandemic and related shutdowns. The 2020-2021 rebound in oil prices is large on a percentage basis thanks to that low starting point, but oil prices at ~$84 remain near 2018 levels, and well below $100+ highs reached in 2008 and 2011-2014 (Chart 1). Note, the same can’t be said for natural gas prices in Europe and coal prices in China, which have reached record levels and are driving a much more acute energy crunch in those economies.
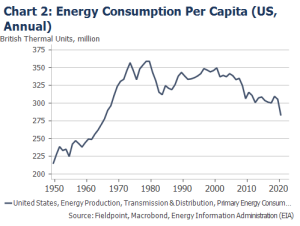
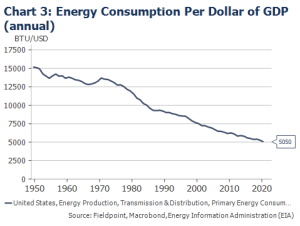
Second, the U.S. economy is very different today than it was in the 1970s. The U.S. economy is less energy-intensive. Chart 2 and Chart 3 show how the amount of energy consumed per capita and per dollar of GDP is materially below where it was in the 1970s. This makes sense given the U.S. economy has shifted away from heavier manufacturing to more services and higher technology, along with better energy efficiency.
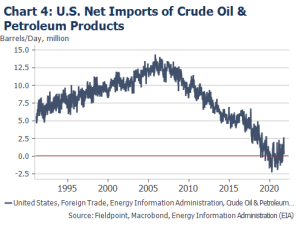
Third, the U.S. became a net oil exporter in 2019 (Chart 4). In 2021, the U.S. is now a small importer, but it still produces more oil than Russia and Saudi Arabia. This leads many to argue that the U.S. can now benefit when oil prices rise, as producers enjoy the higher selling price.
But on this last point is where we push back. There is little evidence to suggest that the benefit to U.S. producers from higher oil prices can offset the downside of higher energy costs to consumers.
What is Good for the Goose Isn’t Great for the Gander
We see a landscape where the energy industry is a beneficiary of higher prices, but those benefits are unlikely to be felt by the larger economy and markets.
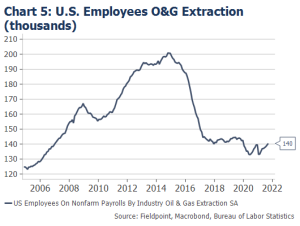
The energy industry is important but relatively small as an employer. The highest estimate we have found is that the total O&G industry employed less than 4.6% of the U.S. workforce in 2019. But since 2019, the O&G industry has shed a lot of jobs and has not added them back.
Chart 5 shows U.S. O&G drilling employees still being lower today than pre-pandemic and much lower compared to the 2011-2014 fracking boom. Even as prices have moved higher recently, hiring has not kept pace (drillers are having similar struggles as other industries finding skilled workers).
A similar story can be told about energy as a driver of investment spending in the economy.
The discovery of effective horizontal drilling/shale drilling/hydraulic fracturing/fracking techniques led to a boom in U.S. energy investment from ~2010-2014. At that time, energy investment did drive jobs and strong manufacturing demand in the U.S.
But after every boom comes a bust, and the unwind of overinvestment in energy was particularly painful, not just for the energy industry but the whole U.S. manufacturing complex, which had arguably become over-indexed to the energy industry during the boom years.
The unraveling of overinvestment came in the form of the 2014-2016 “Industrial Recession”, which saw U.S. manufacturing have to rationalize its exposure to energy production. Companies jettisoned energy exposed businesses and spent the next five years convincing investors that they didn’t have that much energy exposure after all (from the boom time, I still have my vials of special white frac sand that was being expensively trained and trucked around the country to be used in drilling).
Since the bust, energy companies have slashed capex spending on new drilling. Even with higher prices in 2018, the energy capex remained well below 2014 highs. Capex budgets were slashed again in 2020 and have even been cut further in 2021, despite the higher prices experienced this year. Chart 6 from the EIA shows this dynamic.
Source: Energy Information Administration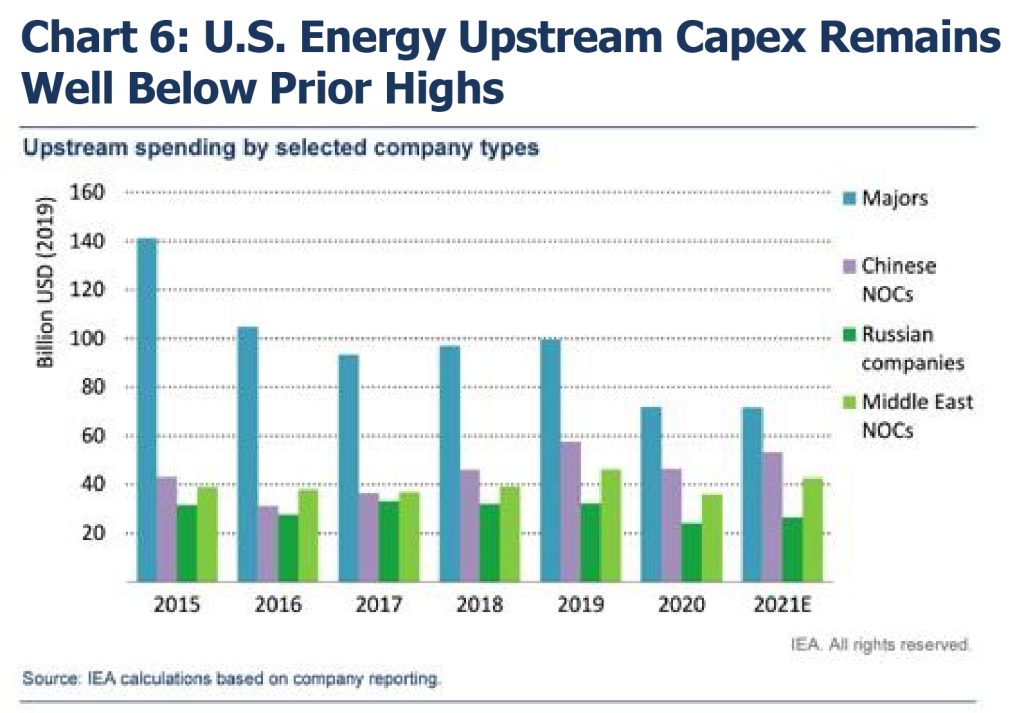
We can see this in practice by looking at the rig count in the U.S. not keeping pace with the rise in prices (Chart 7).
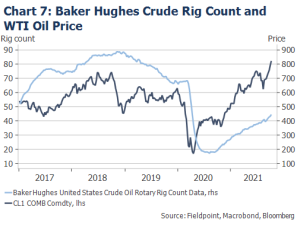
This lower investment has resulted in U.S. oil production remaining below pre-pandemic levels, again despite the higher prices (Chart 8).
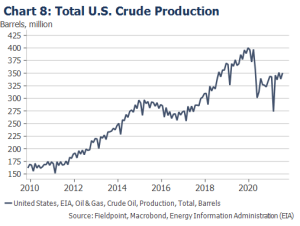
This lack of a rapid addition of production capacity is one contributor to higher prices: supply of oil has not bounced back as fast as demand, pushing prices higher and drawing inventories to be lower.
So why aren’t energy companies spending given higher prices?
This is Why We Can’t Have Nice Things
Energy companies have a long history of expanding capacity aggressively in the upcycle, chasing commodity prices higher.
During the frac boom, many companies spent more in capex than they were generating in operating cash (negative free cash flow), with banks/investors willing to bridge the gap.
Energy companies’ overinvestment has often sealed their own fate, adding so much supply that prices eventually peak. As prices start to drop, energy companies have often been overextended. Some have had to slash dividends, engage in painful restructurings, and even declare bankruptcy.
So, after years of weathering booms and busts in the energy complex, energy investors finally said they have had enough.
Essentially, energy investors no longer trust energy companies to be good allocators of capital into their own businesses.
Over the past three years, investors have pressured companies to keep capex budgets in check, punishing those companies that increase capex with lower stock prices/multiples. Instead of reinvesting in the business, investors want energy companies to return their excess capital to shareholders through dividends and share repurchases, rewarding those “disciplined” companies with higher stock prices/multiples.
So in “normal” times, we would have likely seen energy capex increase given this move in prices (like we saw in 2018), but now these companies are being held accountable, or are being constrained, by shareholders (add on top of this the ESG constraints of reducing fossil fuel spend to meet emissions targets).
This also means that the excess profits from higher oil prices that might have gone to investment in additional capacity and jobs during the “profligate” years are now being returned to equity shareholders.
The end result is that U.S. investment spending in energy-related industries will likely not be enough to offset the potential negative impacts to demand in other areas of the economy if this rise in energy prices persists.
Conclusion
There is a lot more to be discussed about this topic of energy prices on the economy and markets.
How will companies’ margins absorb these higher input costs? What is the point where demand is destroyed by higher prices? At what point will the spare capacity around the world (U.S., OPEC+) be released onto the market, possibly pushing prices lower?
More on this to come in the coming weeks.
Disclosures
IMPORTANT LEGAL INFORMATION
This material is for informational purposes only and is not intended to be an offer or solicitation to purchase or sell any security or to employ a specific investment strategy. It is intended solely for the information of those to whom it is distributed by Fieldpoint Private. No part of this material may be reproduced or retransmitted in any manner without prior written permission of Fieldpoint Private. Fieldpoint Private does not represent, warrant or guarantee that this material is accurate, complete or suitable for any purpose and it should not be used as the sole basis for investment decisions. The information used in preparing these materials may have been obtained from public sources. Fieldpoint Private assumes no responsibility for independent verification of such information and has relied on such information being complete and accurate in all material respects. Fieldpoint Private assumes no obligation to update or otherwise revise these materials. This material does not contain all of the information that a prospective investor may wish to consider and is not to be relied upon or used in substitution for the exercise of independent judgment. To the extent such information includes estimates and forecasts of future financial performance it may have been obtained from public or third-party sources. We have assumed that such estimates and forecasts have been reasonably prepared on bases reflecting the best currently available estimates and judgments of such sources or represent reasonable estimates. Any pricing or valuation of securities or other assets contained in this material is as of the date provided, as prices fluctuate on a daily basis. Past performance is not a guarantee of future results. Fieldpoint Private does not provide legal or tax advice. Nothing contained herein should be construed as tax, accounting or legal advice. Prior to investing you should consult your accounting, tax, and legal advisors to understand the implications of such an investment.
Fieldpoint Private Securities, LLC is a wholly-owned subsidiary of Fieldpoint Private Bank & Trust (the “Bank”). Wealth management, securities brokerage and investment advisory services offered by Fieldpoint Private Securities, LLC and/or any non-deposit investment products that ultimately may be acquired as a result of the Bank’s investment advisory services:
![]()
Such services are not deposits or other obligations of the Bank:
– Are not insured or guaranteed by the FDIC, any agency of the US or the Bank
– Are not a condition to the provision or term of any banking service or activity
– May be purchased from any agent or company and the member’s choice will not affect current or future credit decisions, and
– Involve investment risk, including possible loss of principal or loss of value.
© 2021 Fieldpoint Private
Banking Services: Fieldpoint Private Bank & Trust. Member FDIC.
Registered Investment Advisor: Fieldpoint Private Securities, LLC is an SEC Registered Investment Advisor and Broker Dealer. Member FINRA, MSRB and SIPC.
Cameron Dawson
CFA®,
Chief Market
Strategist