
Weekly Perspective: Shine On You Crazy Diamond Hands

The late 1960s and early 1970s contain many lessons for the historically minded. First, things really never were the same without Syd Barrett. Second, we learned how inflation is created (stepped up fiscal spending starting with the Vietnam War and then the Great Society, geopolitical tensions with OPEC driving up the costs of key input, strong labor union negotiating power, and tight regulations on key industries and trade). Third, we learned that rapid repricing can happen when a pegged currency cannot reflect the inflationary pressures in the economy (the breakdown of the Bretton Woods construct and the gold standard). Fourth, and most importantly for this discussion, we learned how good companies can become bad stocks.
Following a sharp bear market in 1969 that was particularly brutal to smaller market cap stocks, there emerged a collective market desire to own larger blue-chip stocks. These blue chips had strong growth prospects and thus were dubbed “one-decision” stocks because they could simply be purchased and held for the rest of one’s lifetime, with an acceptance of “growth at any price”. Buy and never sell, the original “diamond hands” rallying cry (diamond hands is internet stock slang for an investor who holds an asset despite risks and losses in order to achieve an end goal).
These stocks became known as the Nifty Fifty (there never was an official list, but later one was identified by the Morgan Guaranty Trust, while Kidder Peabody’s monthly list of the 50 Big Board stocks with the highest P/E’s is also given credit). By 1972, the Nifty Fifty had a median price to earnings (P/E) ratio of 36.2x compared to the market’s 16.4x, with many of the names in the group trading well in excess of 50x earnings (source: Stifel). But this is where things get interesting.
Market participants were right about Nifty Fifty’s superior growth prospects. Over the following decade, from 1972 to 1982, the Nifty Fifty had annualized EPS growth of over 10%, besting the S&P 500’s 7% growth rate. However, the Nifty Fifty produced a total return of only 3% over that time, compared to the market’s nearly 7%. How? Multiple compression.
The inflationary spiral of the 1970s hit these expensive stocks hard, as their very full valuations left greater room for multiples to compress in the face of rising bond yields. The Nifty Fifty saw their P/E multiples fall at an annualized pace of almost -10%, compared to -5% for the market, despite the superior fundamentals to the rest of the market.
This is the perfect example of when valuation becomes a risk in and of itself. In his 1977 article How Inflation Swindles the Equity Investor, Warren Buffet details this dynamic. He explains how the supportive macro environment of the 1960s “allowed investors to achieve a return that exceeded the inherent earning power of the enterprises in which they had invested.”
Further, some of the “holds forever” Nifty Fifty stocks did not survive the subsequent decades of rapidly changing economic and business environments. Numerous companies went bankrupt and others were absorbed by other, stronger companies in the future. There was one knock-out winner in the bunch that generated a huge return (it revolutionized the U.S. retail landscape). As Fesenmaier and Smith detail in their 2001 paper The Nifty-Fifty Re-Revisited:
“Perhaps, buying a high P/E stock is like buying a lottery ticket: the expected return is not good, but there is a chance of a huge payoff. Here, 80 percent of the Kidder Peabody stocks underperformed the market, but one (yes, one with a P/E above 50) hit the jackpot.”
There are pushbacks to the notion that the Nifty Fifty was overvalued and resulted in underperformance for shareholders. Jeremy Siegel looked at the performance of the broad Nifty Fifty group over the following 25 years and found returns that trailed the S&P 500 slightly (though with compounding, even this 40 bps lag really adds up over time). Of course, the immediate 10 years of underperformance after the Nifty Fifty peak were far more painful (who would have had the “diamond hands” to ride that through?).
Looked at more narrowly, the Kidder Peabody Terrific 24 list mentioned above is a somewhat purer basket that captures the “growth at any price” psyche of the time, containing only the most expensive names of the group. Owning the most expensive names of the Nifty Fifty would have proven far more detrimental to one’s wealth: “An investor who bought these 24 stocks at the end of 1972 would have had 50 percent less wealth at the end of 2001 than an investor who bought the S&P 500” (Fesenmaier and Smith).
Thus we see how “diamond hands” and holding forever can bite. Narratives make the decision straightforward from a fundamental perspective (“own the best companies”), but they can blind us to environments that cause divergences between companies and stocks.
We have spent a lot of time over the last five months talking about the Value over Growth rotation. One of the most common questions raised by this discussion is: isn’t a long-term investor better off sticking with Growth stocks that have higher growth potential and better business models? Even if valuations are stretched (29x NTM vs. 19x 10-Year average) and the performance differentials are extraordinary (Growth outperformed Value by 36% in 2020, 87% over the last 5 years, and 190% over the last 10 years), shouldn’t long term investors stick with Growth and not rotate into the laggard Value index?
The experience of the Nifty Fifty would argue for a balance between Growth and Value at this juncture. In his 1998 analysis of the Nifty Fifty, Jeremy Siegel had three lessons for investors from the go-go period that deserve a re-broadcasting today:
- You must pay for growth: “good growth stock, like good wines, are often worth the price you have to pay”
- Don’t “pay any price”: “among these growth stocks, lower price-earnings ratios tended to outperform those with higher price-earnings ratios”
- Most importantly, be diversified among various growth stocks and groups: “among the many gems were bad apples”
Chart 1 shows this dynamic at play: the higher the P/E ratio at the peak, the lower the annualized return of the Nifty Fifty stock.
Chart 1: Annualized Return of Nifty Fifty Stocks vs. P/E Ratio (1972-2001)
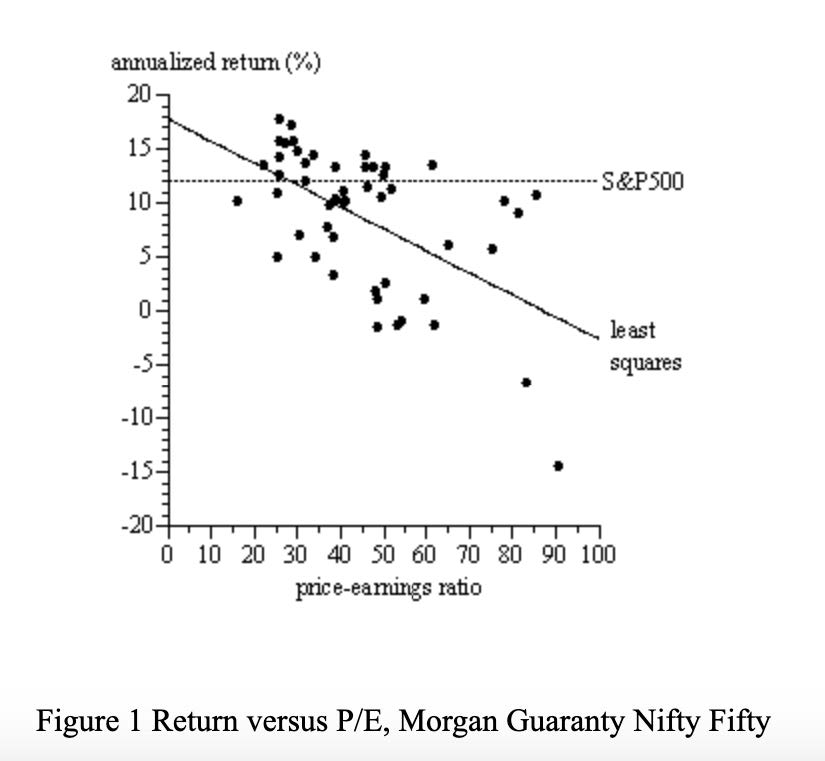
Source: The Nifty Fifty Re-Revisited
So we encourage investors, do not become comfortably numb with narratives that justify “growth at any price”. Take advantage of the bizarre market conditions that led to such sharp Growth outperformance by reducing weightings to these most expensive areas to become more balanced with Value. But that does not necessarily mean fishing for Value in structurally unsound industries (you may be surprised to know that the largest company in the Value index is the world’s largest search engine provider). For long-term investors quality matters (strong free cash flow generation, solid dividend coverage, healthy balance sheets, transparent financials, etc.), which may mean lagging in a deep Value rally, but is far more likely to compound value over the long run. Lastly, after all of this, enjoy a break from the peak in 1972.
Last Week in Markets: Choppy Equities Still End At Records; Long Yields Higher While ECB Promises to Step Up Buying
Equities
Equities endured a volatile week, but managed to produce strong gains and end the week at record highs (S&P 500 +2.64%; NASDAQ +3.09%; Down Jones Industrial Average +4.07%). Small caps were big gainers on the week at +7.32%, bringing the YTD gain for the Russell 2000 to +19.14%. Value (+3.22%) outperformed Growth (+2.47%), widening the YTD performance gap of the two indices (Value +10.89% and Growth -0.25% YTD).
Markets are continuing to wrestle with the implications of higher interest rates, higher growth expectations, and higher inflation expectations. This stirring led to the odd sector performance last week, with traditional yield sensitive areas (Utilities, Real Estate) and long-duration growth /real-yield sensitive areas (Consumer Discretionary led by a large EV maker) all performing well. See the details in Table 1 below.
Table 1: S&P 500 Sector Performance
| Index Name | 1 Week | YTD |
| Consumer Discretionary | 5.7% | 2.1% |
| Consumer Staples | 2.1% | -3.0% |
| Communication Services | 0.7% | 7.9% |
| Energy | 1.1% | 40.1% |
| Financials | 3.2% | 17.5% |
| Health Care | 1.3% | 0.6% |
| Industrials | 3.6% | 8.9% |
| Materials | 4.4% | 8.1% |
| Tech | 1.9% | 0.6% |
| Utilities | 4.4% | -1.3% |
| Real Estates | 5.7% | 6.3% |
Source: Bloomberg, Fieldpoint Private, as of 3/12/21
Fixed Income
There was volatility in the rates market last week as well, with long bond yields ending the week higher. The 10-year rose 3 bps to 1.62%, while the 30-year rose 6 bps to 2.38%. A slight decline in the 2 years (-1bp to 0.15%) led to further steepening of the 10-2 curve. The 5-year yield, the “belly of the curve” where the yield surge was the most volatile and rapid in the past few weeks, saw yields decline slightly last week (-2 bps to 0.84%), signaling some stabilization in that part of the curve.
In contrast to the Fed’s celebration of higher rates as a sign of better growth, last week the European Central Bank (ECB) promised to “significantly” boost the pace of bond purchases in order to put downward pressure on rising yields that are seen as a potential threat to Europe’s fledgling recovery. This dynamic will have to be watched closely, as low Eurozone yields had previously acted as an anchor on U.S. yields. The spread between U.S. and German 10-year yields is now the largest since the start of the pandemic thanks to Fed welcoming the rise in long yields while the ECB talks yield down (see Bloomberg article here). This yield spread could put upward pressure on the dollar as the U.S. higher yields draw capital to USD. The higher spread also puts pressure on the ECB to further increase bond buying in order to keep yields under control if euro investors sell in order to allocate into higher yield dollar assets.
Currencies and Commodities
The dollar weakened slighting last week ( DXY -0.74% to $91.63).
Dollar weakness contributed to the outperformance of Precious metals (+2.5%) over Industrial metals (+0.26%). Within Industrial metals, Copper was higher (+1.62%, YTD +18.5%), while Iron Ore was notably weak (-9.75%).
Disclosures
IMPORTANT LEGAL INFORMATION
This material is for informational purposes only and is not intended to be an offer or solicitation to purchase or sell any security or to employ a specific investment strategy. It is intended solely for the information of those to whom it is distributed by Fieldpoint Private. No part of this material may be reproduced or retransmitted in any manner without prior written permission of Fieldpoint Private. Fieldpoint Private does not represent, warrant or guarantee that this material is accurate, complete or suitable for any purpose and it should not be used as the sole basis for investment decisions. The information used in preparing these materials may have been obtained from public sources. Fieldpoint Private assumes no responsibility for independent verification of such information and has relied on such information being complete and accurate in all material respects. Fieldpoint Private assumes no obligation to update or otherwise revise these materials. This material does not contain all of the information that a prospective investor may wish to consider and is not to be relied upon or used in substitution for the exercise of independent judgment. To the extent such information includes estimates and forecasts of future financial performance it may have been obtained from public or third-party sources. We have assumed that such estimates and forecasts have been reasonably prepared on bases reflecting the best currently available estimates and judgments of such sources or represent reasonable estimates. Any pricing or valuation of securities or other assets contained in this material is as of the date provided, as prices fluctuate on a daily basis. Past performance is not a guarantee of future results. Fieldpoint Private does not provide legal or tax advice. Nothing contained herein should be construed as tax, accounting or legal advice. Prior to investing you should consult your accounting, tax, and legal advisors to understand the implications of such an investment.
Fieldpoint Private Securities, LLC is a wholly-owned subsidiary of Fieldpoint Private Bank & Trust (the “Bank”). Wealth management, securities brokerage and investment advisory services offered by Fieldpoint Private Securities, LLC and/or any non-deposit investment products that ultimately may be acquired as a result of the Bank’s investment advisory services:
Such services are not deposits or other obligations of the Bank:

− Are not insured or guaranteed by the FDIC, any agency of the US or the Bank
− Are not a condition to the provision or term of any banking service or activity
− May be purchased from any agent or company and the member’s choice will not affect current or future credit decisions, and
− Involve investment risk, including possible loss of principal or loss of value.
© 2021 Fieldpoint Private
Banking Services: Fieldpoint Private Bank & Trust. Member FDIC.
Registered Investment Advisor: Fieldpoint Private Securities, LLC is an SEC Registered Investment Advisor and Broker Dealer. Member FINRA, MSRB and SIPC.
Johnny Gibson
CFA®, Chief Investment Officer
Cameron Dawson
CFA®,
Chief Market
Strategist