
Weekly Perspective: Small Caps Defying Gravity; Holding Out For the 1-Year

Equity Trend Check
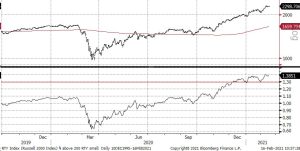
Back in 2020, one measure that was a helpful signal of a near-term overextension in markets that resulted in a pause was the distance that an index was trading above its 200-day moving average. The 200-day moving average is one gauge of a longer-term trend. Back in September of 2020, the Nasdaq (QQQ) rose to 33% above its 200-day moving average (see Chart 1) and subsequently sold off, pausing its string of outperformance vs. the S&P 500 until January of this year. This 33% was the highest since the dot-com bubble, but that blow-off top peak was much more extended at 60% above the 200-day moving average. Regardless, this is one helpful measure to determine when things get ahead of themselves, leading to a near-term pause, so let’s do a check of where we stand today. Note these are shorter-term, tactical signals, whereas factors like high call option volume, high leverage, high valuations, low cash balances, and large equity inflows tend to be longer-term/less-time specific risks.
*Note the bottom panel of each of these charts is the distance of the index above its down 200- day moving average, calculated by dividing the index by the 200-day. This means a reading of 1.21 equals the index being 21% above its 200-day moving average.
Chart 1 shows the QQQ trend check, and though we continue to hit new all-time highs, we are not as extended versus trend as we were in September of 2020.
Chart 1: QQQ (top panel), QQQ Distance Above its 200 Day Moving Average
Source: Bloomberg, Fieldpoint Private
Charts 2 and 3 show the S&P 500 vs. its 200-day moving average in the short-term and long-term. What we can see here is that we just about extended vs. trend as we were in September of 2020, which preceded a correction. This ~16% level has been the long-term “ceiling” of the S&P’s extension versus trend (see red line in Chart 2). Looking at Chart 3, outside of the recovery off of the 2009 lows (it is very different to be extended vs. the 200-day moving average after it has been trending down for two years in a protracted bear market, compared to being extended vs. trend at the end of a long bull run), this is near where the S&P peaked vs. trend in 1999.
Chart 2: Short-Term S&P 500 and S&P 500 vs. 200-Day Moving Average
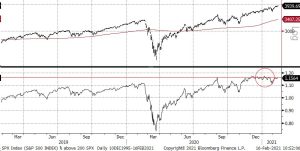
Source: Bloomberg, Fieldpoint Private
Chart 3: Long-Term S&P 500 and S&P 500 vs. 200-Day Moving Average
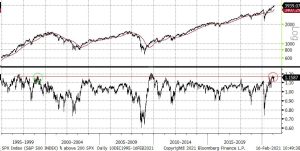
Source: Bloomberg, Fieldpoint Private
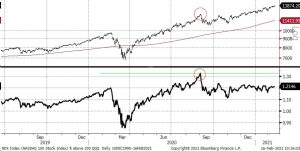
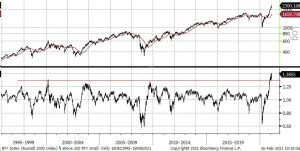
Looking at small-caps, we are truly in unprecedented, defying gravity territory. Partially thanks to being in a sideways-to-down trend for three years, the recent surge in small-cap stocks (Russell 2000) has resulted in this index trading at a whopping and record 38% above its 200-day moving average. We have been trading at above-record levels vs. the 200 days (30%) since early December (see Chart 4), but given how historically unprecedented this is, we wouldn’t be surprised to see a pause/consolidation/pull-back in the near term to work off some of this froth (after all, even Elphaba had to come back down to earth eventually).
Chart 4: Russell 2000 and Russell 2000 vs. 200-Day Moving Average
Source: Bloomberg, Fieldpoint Private
Chart 5: Russell 2000 and Russell 2000 vs. 200-Day Moving Average
Source: Bloomberg, Fieldpoint Private
Holding Out for the One-Year
One of the most fascinating takeaways from 2020 was how right the retail investor was in March/April of 2020, buying into the deep equity market pullback despite the warnings of a “retest of the lows”. The retail investor properly read (whether they knew it or not) that the magnitude of fiscal and monetary stimulus would overwhelm the negative headwinds and worries from the pandemic, resulting in a rapid V-shape recovery in markets (despite the lagging economic recovery). It turned out to be a truly epic buying opportunity, with assets staging incredible rallies off of the lows, leaving many investors with some large, unrealized gains.
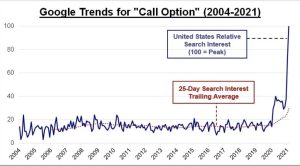
Here’s where things could get interesting: anecdotally, we have heard many retail investors express a desire to delay realizing these gains until they reach the 1-year mark of holding in order to enjoy the lower long-term capital gains tax rate. This means that come late March we could begin to see more serious contemplation from some investors to “take money off the table” given the lower expected tax bill. Maybe this will be negligible given assets are continuing to pour into equities: there was a record $58B inflow into equity funds last week (see Chart 6, see FT article here). However, given the degree of leverage in the system, (call option volume and interest continue to set a record, see Chart 7 and Chart 8), one-sided positioning, and extension above long-term trends (above), there is the risk that a little selling pressure could get amplified as these factors unwind. Stay vigilant.
Chart 6: Net Weekly Inflows into Equity Funds
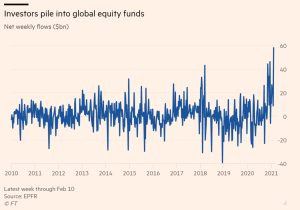
Source: Financial Times
Chart 7: Call Option Volume with 20-Day Moving Average (Green)
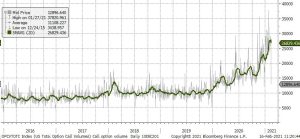
Source: Bloomberg, Fieldpoint Private
Chart 8: Google Search Volume for Call Options
Last Week in Markets: Equities New Highs; Long Yields Rise while 2-Year All-Time Low; Commodities Rally
Equities
Domestic large cap equity markets rallied to new all-time highs last week (S&P 500 +1.3%, NASDAQ +1.7%, Dow Jones Industrial Average +1.1%). Smaller cap indices outperformed once again (Russell 2000 +2.5%, S&P 400 Mid-Cap +2.7%). Value (+1.81%) outperformed Growth (+1.24%).
From a sector perspective, Energy was the leader again (+4.33%, +17% YTD) thanks to higher oil prices. Tech (+2.3%) and Financials (+2.0%) were also at the front of the pack this week. Consumer Discretionary (-1.26%) was a laggard due to a weak response to a large company’s earnings (though it was a beat vs. expectations), while defense sectors Utilities (-1.79%) and Staples (-0.1%) were the other sectors in the red for the week. Another defensive area, Real Estate (+1.12%) was actually up on the weak due to strong share price reactions to earnings in the more beaten parts of the sector (office, shopping, and healthcare REITs).
On earnings, 74% of S&P 500 companies have reported Q420 results. 80% of companies have reported EPS above estimates, with an aggregate beat of 15% above estimates. The last three quarters have each been one of the three largest degrees of surprise vs. estimates since FactSet started tracking the metric in 2008. Earnings growth is tracking at +2.9% for 4Q20, vs. estimates for a -9.3% decline at the end of the quarter (Chart 9 shows a breakdown of earnings growth vs. end-of-quarter estimates by sector). The response to these earnings beats remains muted on the day of reporting, with last week’s 1-day price change on earnings day a negative -0.6% vs. the average 19% beat.
The VIX closed the week -4.3% at 20.
Chart 9: 4Q20 Earnings Growth by Sector vs. End-of-Quarter Expectations
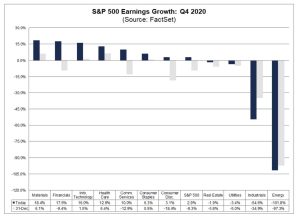
Source: FactSet
Fixed Income
Long-dated Treasury yields moved higher last week (bonds sold off) with the 10-Year yield +4 bps to 1.21% (the highest since March 2020) and the 30-Year yield +6 bps to 2.01% (back to pre-pandemic levels. Interestingly inflation expectations fell on the week (5 Year 5Year Forward Breakeven -5bps to 2.13%), meaning the movement higher in yields was due to higher term premiums. Of course, the Fed continues to hammer down the short end of the curve (and downward pressure as the Treasury works down its cash balance, shrinking supply), with the 2-Year remaining largely unchanged at 0.11%, allowing the curve to steepen materially. The 10-2 spread is now at 112 bps, the highest since 2017. Chart 10 shows the U.S. yield curve today (solid line) vs. six months ago (dashed line). You can see the movement lower in short term interest rates as investors continue to expect the Fed to remain ultra-accommodative (green circle), while the longer end of the curve has moved higher thanks to hopes of an economic and inflation rebound helped by vaccine roll-out and increased fiscal policy support (purple circle).
Chart 10: U.S. Treasury Yield Curve
Note steepening vs. 6 months ago, with long end of the curve moving higher on growth/inflation optimism from vaccines/fiscal stimulus, while short end of the curve remains suppressed by ultra-accommodative Fed policy
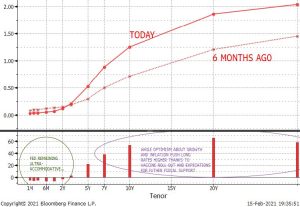
Source: Bloomberg, Fieldpoint Private
Currencies and Commodities
The U.S. Dollar was slightly weaker on the weak (DXY -0.05% to $90.48). Industrial metals (+4.3%) outperformed Precious metals (+0.7%) once again, in another sign of risk-on, pro-cyclical, pro-inflation trading. WTI crude prices rallied 4.6% and as of Monday evening WTI has now crossed over $60, a 13-month high, due to higher demand and supply disruption from the freeze/winter storms in Texas (see Reuters article here). The deep winter conditions experienced in the center of the country are also pushing up natural gas prices, which were up +4% last week.
Last Week Economic Data: Stimulus Views, Jobs, Inflation, Consumer Confidence
Stimulus
As the odds of the Biden administration being able to pass the full $1.9T of stimulus, a number of analyses have been done comparing the next stimulus to prior packages, as well as looking at the economic impact.
Chart 11 is from a Bloomberg article that details the level of direct stimulus checks to individuals and households by income level. The Biden proposal provides significantly more direct stimulus to households compared to the December stimulus and CARES Act.
Chart 11: A lot more direct stimulus checks if Biden plan is passed
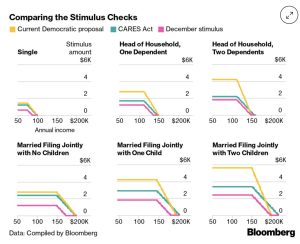
Source: Bloomberg
Chart 12 is from analysis done the Hamilton Project/Brookings Institute which projects that the passing of Biden’s stimulus package would result in 4% GDP growth by the end of 2021, which would bring the U.S. back to, and even above pre-pandemic trend line growth. The group projects that without additional support, U.S. real GDP growth would remain below pre-pandemic trend growth until 2023.
Chart 12: Hamilton Project GDP Projections Under Biden Stimulus vs. No Additional Support Compared to Pre-Pandemic Trend Line GDP
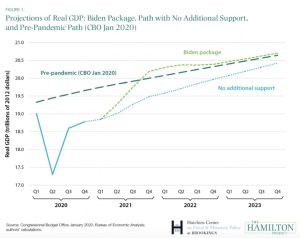
Source: The Hamilton Project
Jobs
Initial jobless claims fell by 19k to 793k for the week ending February 6th, which was less than expected. This Bloomberg article details how an increasing number of workers field for the supplemental Federal unemployment programs in January due to the timing (delayed signing) of the extension of these programs in the December 2020 stimulus bill.
Inflation
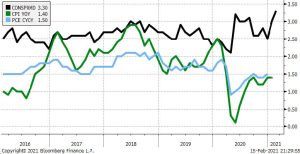
The headline CPI came in lower than markets were expecting (1.4% vs. 1.5% YoY). Chart _ shows Core CPI (ex food and energy), ticking down in January, despite market expectations for higher inflation.
Chart 13: Core CPI (ex Food and Energy) YoY
1.4% vs. 1.5% cons
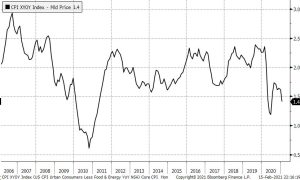
Source: Bloomberg, Fieldpoint Private
There continues to be a meaningful divergence between goods and services inflation. Chart 14 shows CPI for goods (commodities) ex-food and energy (black line) compared to CPI for services (green line). Since the lockdowns, inflation for services has collapsed, while inflation for goods initially was in deflation and is now in inflation.
Chart 14: CPI YoY Services (green) and Goods/Commodities Ex Food and Energy (black)
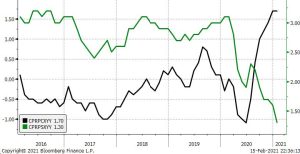
Source: Bloomberg, Fieldpoint Private
Consumer Confidence
The University of Michigan Consumer Sentiment Index for January came in below expectations (76.2 vs. 80.9 cons), ticking lower from the December reading. This measure of consumer confidence remains well below pre-pandemic levels (see Chart 15). There continues to be a strong political party affiliation component to measures of consumer confidence, as seen in Chart 16. Related to the inflation discussion above, Chart 17 contrasts the consumer inflation expectations from the University of Michigan survey and the observed Consumer Price Index (CPI) and the Core Personal Consumption Expenditures; the chart shows that consumers continue to expect more inflation than they realize with either the CPI of PCE measurement of realized inflation.
Chart 15: University of Michigan Consumer Sentiment Index
Remains well below pre-pandemic levels, came in below expectations for Jan-21
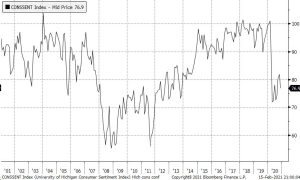
Chart 16: University of Michigan Consumer Sentiment Index by Political Party Affiliation
Republican-affiliated consumer confidence falls after November 2020 election, while Democrat affiliated consumer confidence rises; opposite after November 2016 election
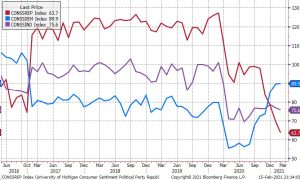
Source: Bloomberg, Fieldpoint Private
Chart 17: University of Michigan Inflation Expectations in 1 Year (black), CPI YoY (green), PCE YoY (blue)
Consumers continue to expect more inflation than they realize by the CPI or PCE measures
Source: Bloomberg, Fieldpoint Private
This Week Data
- Monday: Presidents’ Day, markets closed
- Tuesday: no major reports
- Wednesday: Release of Fed minutes; retail sales; business inventories; industrial production; housing market index
- Thursday: Weekly unemployment claims; housing starts, export/import price
- Friday: Existing home sales
Disclosures
IMPORTANT LEGAL INFORMATION
This material is for informational purposes only and is not intended to be an offer or solicitation to purchase or sell any security or to employ a specific investment strategy. It is intended solely for the information of those to whom it is distributed by Fieldpoint Private. No part of this material may be reproduced or retransmitted in any manner without prior written permission of Fieldpoint Private. Fieldpoint Private does not represent, warrant or guarantee that this material is accurate, complete or suitable for any purpose and it should not be used as the sole basis for investment decisions. The information used in preparing these materials may have been obtained from public sources. Fieldpoint Private assumes no responsibility for independent verification of such information and has relied on such information being complete and accurate in all material respects. Fieldpoint Private assumes no obligation to update or otherwise revise these materials. This material does not contain all of the information that a prospective investor may wish to consider and is not to be relied upon or used in substitution for the exercise of independent judgment. To the extent such information includes estimates and forecasts of future financial performance it may have been obtained from public or third-party sources. We have assumed that such estimates and forecasts have been reasonably prepared on bases reflecting the best currently available estimates and judgments of such sources or represent reasonable estimates. Any pricing or valuation of securities or other assets contained in this material is as of the date provided, as prices fluctuate on a daily basis. Past performance is not a guarantee of future results. Fieldpoint Private does not provide legal or tax advice. Nothing contained herein should be construed as tax, accounting or legal advice. Prior to investing you should consult your accounting, tax, and legal advisors to understand the implications of such an investment.
Fieldpoint Private Securities, LLC is a wholly-owned subsidiary of Fieldpoint Private Bank & Trust (the “Bank”). Wealth management, securities brokerage and investment advisory services offered by Fieldpoint Private Securities, LLC and/or any non-deposit investment products that ultimately may be acquired as a result of the Bank’s investment advisory services:
Such services are not deposits or other obligations of the Bank:

− Are not insured or guaranteed by the FDIC, any agency of the US or the Bank
− Are not a condition to the provision or term of any banking service or activity
− May be purchased from any agent or company and the member’s choice will not affect current or future credit decisions, and
− Involve investment risk, including possible loss of principal or loss of value.
© 2021 Fieldpoint Private
Banking Services: Fieldpoint Private Bank & Trust. Member FDIC.
Registered Investment Advisor: Fieldpoint Private Securities, LLC is an SEC Registered Investment Advisor and Broker Dealer. Member FINRA, MSRB and SIPC.
Cameron Dawson
CFA®,
Chief Market
Strategist
Johnny Gibson
CFA®, Chief Investment Officer