
Weekly Perspective: What’s Going On in the Treasury Market?

In our 2021 Outlook we detailed how the extraordinary actions of policy makers in 2020 had resulted in a market of “records, distortions, and extremes”. This created a “coiled spring” of financial repression/manipulation where many financial indicators/markets could see rapid repricing/reversals if a catalyst emerged.
Well, we got some of those rapid moves last week. Long yields jumped higher, equity leadership rotations intensified, and long lagging assets (like commodities) continued their sharp outperformance.
What Happened: “Well that escalated quickly”
Treasury yields had a volatile week, pushing longer dated yields higher and causing shock waves through global asset markets. The sell-off reached a fever pitch on Thursday, after a “brutal” auction of 7-year bonds received much less demand than expected (see Barron’s article here). Bond markets recovered on Friday, which brought the week’s moves back out of extreme territory. For all of the angst, 10-Year yields “only” increased 7 bps to 1.45% last week, but had reached as high as 1.6% on Thursday. 30-Year yields only increased 2 bps to 2.15% last week after touching 2.39%. The real drama was in the belly, or 5-Year yields, which increased 12 bps to 0.72% but went as high as 0.84% last week (Chart 1 shows the 5-Year yield over the last 6 months in order to see how sharp Thursday’s move higher in yields was).
Chart 1: 5-Year Treasury Yields (6 months, daily)
5-year yields experience huge move higher (bond prices sell-off) on Thursday
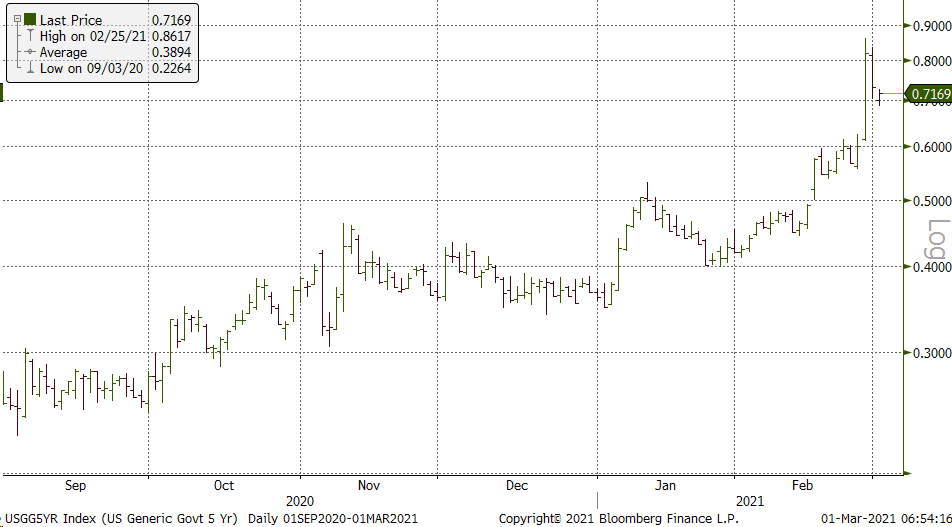
Source: Bloomberg, Fieldpoint Private
Though Treasury yields remain low on an absolute basis, longer dated yields have increased materially off of their recent, pandemic lows. The 10-Year Treasury at 1.45% is almost 3x higher compared to its low at the beginning of August 2020 at 0.5%. Chart 2 shows the 6 month percentage change in 10-Year yields, which has been even larger than the percentage change in yields following the 2009 GFC reflation, 2013 taper tantrum, and 2016 “trumpflation” bond sell-offs.
Chart 2: 6-Month Percentage Change in 10-Year Treasury Yields
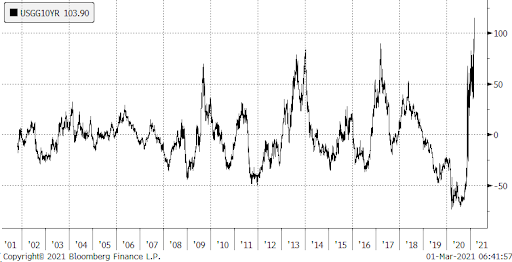
Source: Bloomberg, Fieldpoint Private
Treasury volatility also picked up last week, as measured by Treasury MOVE Volatility Index (think of it like the VIX but for bonds). After reaching and hovering near record lows in the second half of 2020 thanks to extraordinary Fed action, the implied volatility of Treasuries spiked last week. It appears that the lack of movement in 2-year yields (which continue to be hammered lower by the Fed’s ultra-accommodative policy stance and a paucity of short dated debt due to Treasury accounting dynamics) is keeping the overall MOVE index lower than what might be expected given the movement in yields farther out the curve. Regardless, the days of the Fed stamping out all bond volatility look to be over.
Chart 3: Treasury MOVE Index
Spiked last week after reaching a record low in 2020, likely being muffled by 2-year not moving
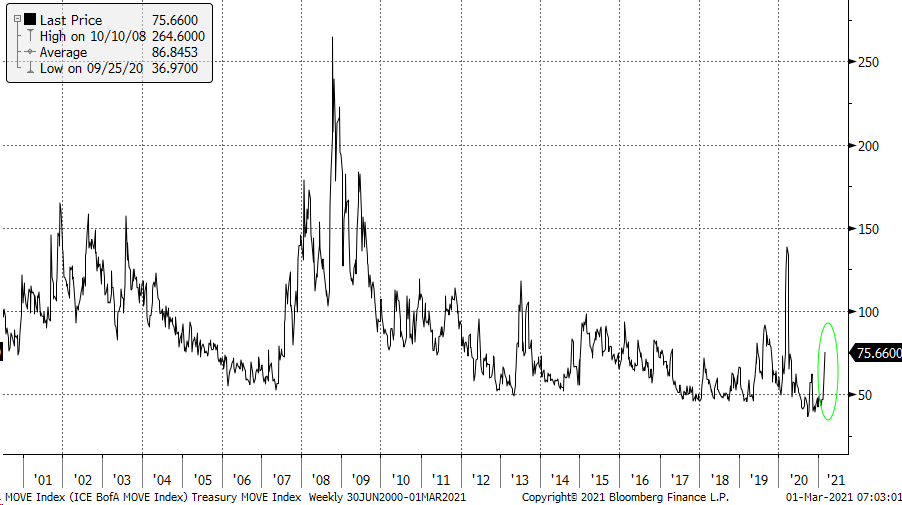
Source: Bloomberg, Fieldpoint Private
For what it’s worth, the sell-off in long dated bonds (bond prices and yields move in opposite directions), as measured by the TLT, looks to have reached an extreme, which could argue for a pause and even a move lower in yields from here as we digest the big move from last week. Chart 4 shows the distance between TLT and its own 200-day moving average, capturing that this sell-off has now reached an historical extreme level. Each time after reaching this level, there was a move higher in the TLT price (and a move lower in yield). How long a pause/reversal would last is of course unknown. Given U.S. 10 year rates remain below pre-pandemic levels, while growth and inflation are expected to be robust in the near term, we would not be surprised to see the upward pressure on rates resume after a pause. We will be watching the reaction coming off of this extreme level closely.
Chart 4: TLT Long Duration Treasury Bond ETF (top panel) & TLT vs. its 200-day moving average (bottom panel)
Sell-off in long duration bond prices is at a historical extreme, past observations have seen bond sell-off pressure abate with prices higher and yields lower
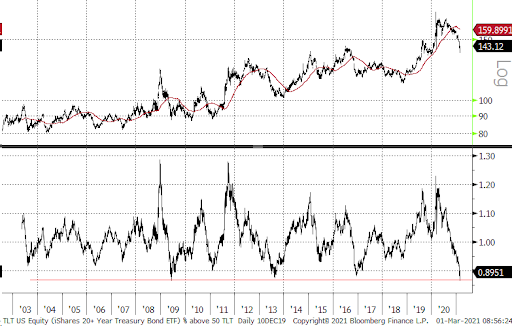
Source: Bloomberg, Fieldpoint Private
Middle Child Syndrome: Most Pain in the Belly of the Curve
Just like middle children that often get overlooked (sorry, sis), recently 5-year yields had not been receiving the same attention as 2’s and 10’s. All that changed last week when 5-year yields, or the belly of the yield curve, saw the most brutal sell-off (shown in Chart 1 above). There are a few explanations for this.
First, 5-year yields capture medium-term expectations for inflation, growth, and Fed policy. Last week saw traders pull forward their expectations for Fed rate increases, now pricing in the first rate hike in December 2022 vs. mid-2023. 5-year yields are considered to be an important gauge of financial conditions as well (see Bloomberg article here), meaning a move higher indicates tighter financial conditions.
Throwing on an extra layer of complexity, there were also explanations that last week’s move in 5-years had to do with trader positioning (big long positioning in 5’s to fund shorts on 30’s to play curve steepening, (see quick audio explanation here) as well as convexity hedging. Essentially, this is a negative feedback loop where selling begets more selling (we’ll spare you the details, but see Bloomberg article here, and QuickTake explainer here for more).
All My Little Plans and Schemes: It’s Real Love (Rates), Not Inflation Expectations
It will surprise many, but long term market based inflation expectations have been falling the past three weeks (see Chart 4). This is because of how these inflation expectations are derived (comparing the yield on a nominal bond to the yield on an inflation adjusted bond), but it signals that real yields are climbing faster than nominal yields. Real rates are being pushed higher by risking growth expectations, bets that the Fed will normalize policy sooner, and possibly some supply/demand dynamic given the contemplation of heavy Treasury issuance to fund big fiscal deficits. Chart 5 from The Daily Shot shows this movement in real rates in February compared to inflation expectations.
Chart 5: U.S. 5Y5Y Forward Inflation Expectations
Falling the past 3 weeks as real yields have been the driver of the move higher in interest rates
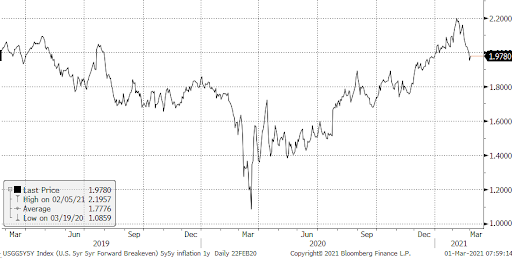
Source: Bloomberg, Fieldpoint Private
Chart 6: February’s Move in Rates Driven by Real Yields Not Inflation Expectations
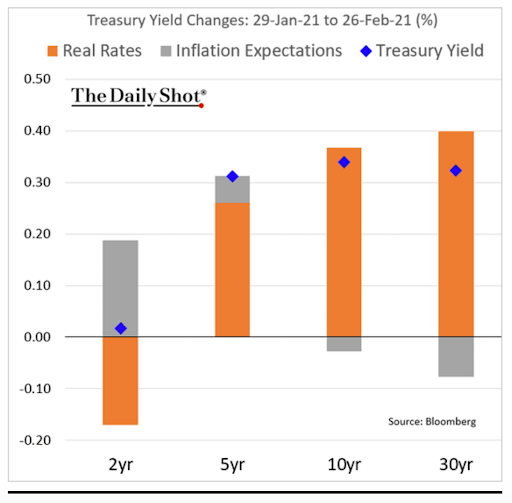
Source: The Daily Shot
As we have written about often, real rates are very important for risk asset prices, primarily long-duration growth, technology, speculative stocks. We show Chart 6 (real rates and growth vs. value) and Chart 7 (real rates and NASDAQ PE) again to illustrate how important of a driver the collapse in real rates has been to supporting elevated valuations and risk appetites. If we continue to see upward pressure on real rates, expect continued downward pressure on growth/technology stock performance and support for value stock outperformance, meaning continued rotation in leadership.
Chart 7: Growth (RLG) vs. Value (RLV) & U.S. 10 Year Real Interest Rate (inverted, red line)
Growth vs. Value peaked in September when the 10 Year Real Yield Bottomed
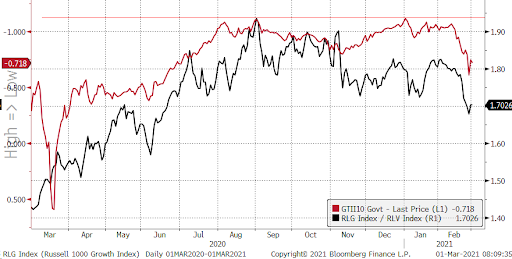
Source: Bloomberg, Fieldpoint Private
Chart 8: NASDAQ Comp P/E Ratio (red) & U.S. 10 Year Real Interest Rate (black, inverted); through 12/31/20);
The green circle shows the “Powell Pivot” which signaled that the tightening cycle was over and led to a collapse in real yields and a sharp move higher in tech/long-duration valuations
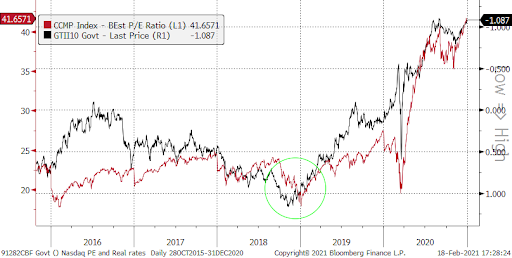
Source: Bloomberg, Fieldpoint Private
How Do You Solve a Problem Like Reflation? How Do You Catch a Yield and Pin it Down?
What will policy makers do in the face of rapidly rising yields, if they do prove to impact asset prices and the real economy? We’ve already seen a swift policy response in other developed markets: Australia quickly announced an unscheduled $3B purchase of longer dated bonds to keep yields in check (see Bloomberg article here). The ECB has said that it is watching the movement in yields “closely” (read: they don’t like the direction things are moving), saying that stimulus could be added if needed (see Bloomberg article here). South Korea also announced additional bond purchases, while Japan is expected to exercise its yield curve control plan to squash the rise in rates (see Bloomberg article here).
And then there’s Powell, who instead of talking down rising rate markets last week with an indication that the Fed might be willing to respond, classified the rise in rates as a “statement of confidence” in the U.S. economic recovery (see Bloomberg article here). There was a similar approach of higher-rates=strength that characterized the 2013 Taper Tantrum, which allowed long rates to run well ahead of Fed policy rates/intentions (see tweets here). Many investors/traders are now projecting that the Fed will respond to higher long term rates through some kind of yield curve control to keep long rates low. Purportedly this would support the real economy by keeping borrowing rates like mortgages low and possibly enable higher deficit spending by keeping government borrowing rates low. Cue the articles about the return of the bond vigilante (see FT article here).
Don’t Bring Me Down: Higher Yields and Equities
In addition to sparking the rotation in leadership detailed above (higher real rates hurt growth/technology/long-duration stocks), there is great debate as to how well equity markets will stomach further moves higher in rates. There are two factors to watch: where rates are relative to recent history (say 5 years, meaning rates are still benign), and how quickly rates are moving higher (not so benign, as shown above).
Further increases in interest rates will certainly weigh on the relevance of recent equity risk premium arguments that have been used to justify nosebleed valuations. The equity risk premium compares equity valuations to rock-bottom yields and argues that is supportive of continued upside in equity valuations, despite elevated absolute valuations (see our December 2020 note, The Fisher Fed, for a deeper explanation). These arguments (made by the likes of Powell and Robert Shiller) ignored the possibility that bond yields could be the ones to move higher to close the gap with equity earnings yields (instead the gap pushing equity prices higher).
Conclusion
There are a lot of moving parts here. Simply put, the selloff in long dated bonds looks to be at an extreme, so we would not be surprised to see a pause in the near term, which could also pause the Value vs. Growth rotation. We would not be surprised to see upward pressure on rates resume in the spring/summer months as reopening accelerates, vaccine distribution widens, inflation/growth numbers look robust, and further stimulus gets released. We still see the extreme outperformance of Growth vs. Value in 2020 as rationale to continue to rebalance large Growth overweights into a more balanced allocation with Value, thus a near-term pause in Value could provide an opportunity for this rebalancing.
Last Week in Markets:
Equities
U.S. large cap indices were negative last week (S&P 500 -2.45%, NASDAQ -4.92%, Dow Jones Industrial Average -1.78%) with the sharp move higher in longer dated yields. The Russell 2000 Small-Cap Index declined -2.9%. Growth (-4.45%) significantly underperformed Value (-1.01%). The move higher in long term real interest rates particularly hurt the growth/tech/speculative area of the market, with FANG -6.26%, IPO’s -9%, and a popular “innovation” ETF -14.58%.
Table 1 shows the sector performance breakdown. Commodity sensitive and higher rate beneficiaries (Energy, Financials) continued their YTD leadership. Rate sensitive areas like Utilities underperformed sharply, as well as Tech, which had been a big beneficiary of deeply negative real rates.
Table 1: S&P 500 Sector Performance
Reflationary sectors lead while rate sensitive and growth lag
| Index Name | 1 Week | YTD |
| Consumer Discretionary | -4.9% | -0.6% |
| Consumer Staples | -2.7% | -6.7% |
| Communication Services | -1.4% | 4.6% |
| Energy | 4.3% | 25.9% |
| Financials | -0.4% | 9.2% |
| Health Care | -1.6% | -1.0% |
| Industrials | -0.5% | 2.0% |
| Materials | -2.1% | 1.2% |
| Tech | -4.0% | 0.1% |
| Utilities | -5.1% | -7.4% |
| Real Estates | -2.0% | 1.9% |
Source: Bloomberg, Fieldpoint Private
Fixed Income
I think we have had enough of that, no?
Currencies and Commodities
The Dollar strengthened slightly last week (DXY +0.57% to $90.88). The USD continues to be stuck in a tight range (slightly higher YTD +1.05%), which is likely a function of the very short dollar positioning to start the year, which left few incremental sellers on the sidelines to bet on a weaker dollar.
Industrial metals (-1.14%) outperformed Precious metals (-2.83%), as higher interest rates weighed on gold (-2.81%). Copper continued its rally (+0.5%, +16.35% YTD). Crude prices continued to rally, now at $61.50 (+3.81%, +26.75% YTD).
Disclosures
IMPORTANT LEGAL INFORMATION
This material is for informational purposes only and is not intended to be an offer or solicitation to purchase or sell any security or to employ a specific investment strategy. It is intended solely for the information of those to whom it is distributed by Fieldpoint Private. No part of this material may be reproduced or retransmitted in any manner without prior written permission of Fieldpoint Private. Fieldpoint Private does not represent, warrant or guarantee that this material is accurate, complete or suitable for any purpose and it should not be used as the sole basis for investment decisions. The information used in preparing these materials may have been obtained from public sources. Fieldpoint Private assumes no responsibility for independent verification of such information and has relied on such information being complete and accurate in all material respects. Fieldpoint Private assumes no obligation to update or otherwise revise these materials. This material does not contain all of the information that a prospective investor may wish to consider and is not to be relied upon or used in substitution for the exercise of independent judgment. To the extent such information includes estimates and forecasts of future financial performance it may have been obtained from public or third-party sources. We have assumed that such estimates and forecasts have been reasonably prepared on bases reflecting the best currently available estimates and judgments of such sources or represent reasonable estimates. Any pricing or valuation of securities or other assets contained in this material is as of the date provided, as prices fluctuate on a daily basis. Past performance is not a guarantee of future results. Fieldpoint Private does not provide legal or tax advice. Nothing contained herein should be construed as tax, accounting or legal advice. Prior to investing you should consult your accounting, tax, and legal advisors to understand the implications of such an investment.
Fieldpoint Private Securities, LLC is a wholly-owned subsidiary of Fieldpoint Private Bank & Trust (the “Bank”). Wealth management, securities brokerage and investment advisory services offered by Fieldpoint Private Securities, LLC and/or any non-deposit investment products that ultimately may be acquired as a result of the Bank’s investment advisory services:
Such services are not deposits or other obligations of the Bank:

− Are not insured or guaranteed by the FDIC, any agency of the US or the Bank
− Are not a condition to the provision or term of any banking service or activity
− May be purchased from any agent or company and the member’s choice will not affect current or future credit decisions, and
− Involve investment risk, including possible loss of principal or loss of value.
© 2021 Fieldpoint Private
Banking Services: Fieldpoint Private Bank & Trust. Member FDIC.
Registered Investment Advisor: Fieldpoint Private Securities, LLC is an SEC Registered Investment Advisor and Broker Dealer. Member FINRA, MSRB and SIPC.
Johnny Gibson
CFA®, Chief Investment Officer
Cameron Dawson
CFA®,
Chief Market
Strategist