
Invisible Gorillas Part 2: The Non-Inflation Risk List

We used the lessons from Chabris and Simons’ “invisible gorillas” experiment to illustrate this question. Their experiment revealed the prevalence of inattentional blindness, where participants were so focused on one task (counting passes of a basketball in a video) that half of them completely missed a major intruder in the scene (a woman in a gorilla suit).
So, to try not to fall prey to the plight inattentional blindness, meaning missing out on major intruders like invisible gorillas because we are focusing too much on one thing, we intentionally want to look outside of inflation for sources of risk in this market (next week we’ll look at opportunity).
This task comes with some important caveats.
The first is that we are not saying that elevated inflation is not a risk, just that it likely is not the only risk.
The second is that financial markets are deeply interconnected, so we cannot isolate inflation as an independent variable. Inflation may cause and/or be the result of some of the unique risks we identify.
Third, we are going to define risk in the narrow context of what could cause risk assets (equity, credit, etc.) to come under price pressure over the next 6-12 months. Certainly, there are bigger, longer term risks to contemplate, but we think this is the most helpful context as we get prepared to enter 2022.
Last, this assessment is by no means comprehensive, it is simply a start (and we would welcome readers’ own thoughts on lurking invisible gorillas!).
Invisible Gorillas Risk List
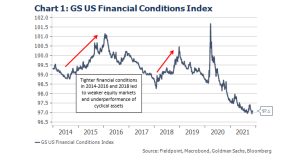
1. The most important chart to watch in 2022: financial conditions
We think financial conditions will be the key indicator to watch for risk assets in 2022. Financial conditions indices combine items like short and long interest rates, the US dollar, equity valuations, and credit spreads into one index that captures how tight or easy financial conditions are across the broad market.
Recently, even though short rates have moved higher as bond traders anticipate tighter Fed policy, financial conditions have plumbed new all-time low, easy levels. However, if the USD continues to press higher or real rates move out of deeply negative levels, financial conditions will be the key signal for when incrementally tighter liquidity is becoming “too much” for high priced risk assets to bear.
The lesson from 2018’s weak equity market remains poignant: a strong fundamental backdrop of robust earnings and economic growth may not be enough to offset a tightening liquidity environment.
2. Rotation, rotation, rotation: real yields, tech valuations, and index heavyweights
Lower inflation could actually be bad for the stock market in 2022. Here’s why:
As inflation likely slows later in 2022 (tough comps, easing supply chain pressures), even if nominal interest rates stay constant, real rates would move higher with this lower inflation.
REAL RATES = NOMINAL RATES – INFLATION
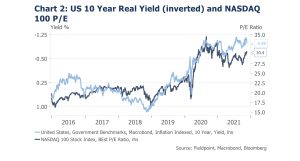
Falling real rates have been a key driver of expanding Growth/Tech/TAAAMM+ (our first stab at the new dominant tech acronym!) valuations ever since the “Powell Pivot” in late 2018, seen in Chart 2.
If real rates start to rise, we would expect valuation pressure and underperformance amongst these S&P 500 index heavyweights, just like what happened in late 2020/early 2021. During that time, we had a powerful Value rally to buoy indices (followed by a meaningful Growth rally as Value stalled in 2Q21 and real rates resumed their descent when high inflation readings began).
If real rates look set to rise in 2022, this could be a key risk for index level returns as index heavyweights come under valuation pressure.
3. “We’re not gonna take it”: labor unrest and potential margin pinching wage increases
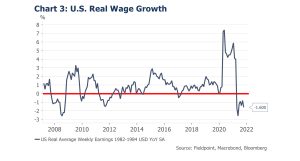
Instead of slowing substantially in 2022 as consensus expects, we see risk that wage gains could continue into next year, possibly posing a risk to corporate margins.
Notable strikes and protests in 2021 have proven successful in achieving better remuneration for workers, which could spark further labor action in 2022 (watch the LA/Long Beach port operator contract renegotiations and the new, possibly less corporate friendly, Teamsters president).
With a tight labor market (the “great resignation” and near record job openings), the pinch from negative real wage growth (wages are not growing as fast as inflation, Chart 3), and anger from not sharing in the spoils of the post-pandemic boom, workers are seizing the opportunity to press for better pay and benefits (making Blyth and Lonergan’s early 2021 outlook in Angrynomics look notably prescient).
Official Bureau of Labor Statistics data counts the number of work stoppages at just 12 in 2021 (well below 1974’s 424, but the new Labor Action Tracker project by Cornell’s ILR School puts the strike count at over 200 for this year (because it also counts strikes of under 1,000 workers).
Higher wages could put pressure on operating margins, which are currently at record highs, as the offsetting benefits from operating leverage fade in 2022 due to sales growth returning to more normal rates (this is worth unpacking in a deeper dive).
4. The bigger they are, the harder they fall: Investor sentiment and valuation as a risk amplifier
We think the best way to think about sentiment and valuation risk is as an amplifier of downside magnitude once a catalyst sparks an unwind in risk assets.
These two factors may not be great timing tools (or risks in and of themselves), but knowing where these factors stand versus history is helpful in gauging how large a future risk-off move could be.
If sentiment and valuation are not stretched, there is simply less room to fall to “washed out” or cheap levels. But when sentiment and valuation are very extended versus history, there is much more room to correct.
With this idea we note that sentiment and valuation are stretched versus history, but they have been stretched for the past year, all while equity returns have been extraordinary.
Once an unwind is sparked, these stretched metrics in sentiment (like a low put/call ratio showing positioning complacency, or falling cash balances compared to record high margin loan balances) and valuation (every valuation metric except those comparing equities to bonds, another expensive asset class) pose the risk of amplifying a downside move.
But as 2021 proved, these indicators are not reliable for shorter term allocation decisions.
5. Back against the wall: China, stimulus, regulation, and geopolitics
China is in an interesting predicament.
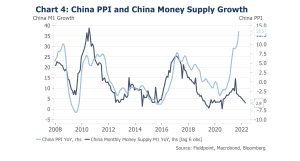
Unlike prior cycles, where planned deleveraging, reduction in policy support, and consolidation of power coincided with deflationary environments, partially due to China’s consumption of raw materials slowing, this cycle China is faced with flagging domestic demand while inflation remains elevated in key areas.
We can see this in Chart 4 by noting the divergence of China’s PPI reaching new highs, while China’s M1 Money Supply Growth slows materially. These two metrics used to follow each other closely (with money supply growth leading by about 6 months). Low inflation during tightening cycles gave China room to stimulate and stoke inflation in the upcycle, but that is not the case today.
Given the property led slowdown in growth, investors are keen for any signs that China could move to increase stimulus, but this means threading the needle of providing policy support without further stoking inflation (as has happened in the past). This is one reason why there is a new “green” overlay to expected policy support, and could mean that the next round of policy support is less “pro-cyclical” from a stock perspective (think old economy construction, mining, etc.).
China’s regulatory crackdown remains a risk for domestic company investors, while the prospects of flaring geopolitical tensions cannot be ignored as a source of tail risk (see recent hypersonic missile tests and escalations in the South China Sea).
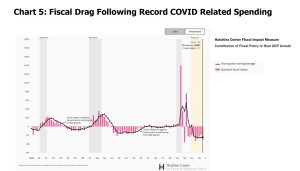
6. Gridlock into a cliff: midterm elections as a source of volatility as the fiscal drag kicks in
The prospect for gridlock in Washington, due to the possibility of Democrats losing either or both of their thin majorities in the House and Senate during the 2022 midterms, would dampen the outlook for further fiscal spending.
After $5.4T of pandemic related fiscal spending in 2020 and 2021, even the $550B of additional infrastructure spending recently passed will not offset the coming “fiscal cliff”, or drop off in fiscal spending from one year to the next, resulting in a drag on GDP growth.
Fiscal cliffs have not necessarily been a problem for broad equity markets in the past (consider 2013’s fantastic 27% return during a drop off in federal spending), but this equity resilience may be because the drop off in fiscal support often happens in the early years of a recovery when equity valuations and positioning remain below averages (which is certainly not today’s market environment).
This Brookings Institution Hutchins Center for Fiscal Impact Measure chart shows that the fiscal drag is expected to be about a 2.5% hit to real GDP through 2023 and beyond, which is of greater magnitude than the drag post the great financial crisis (GFC).
7. Our Dark Passenger: COVID continues to impact markets
As much as we would like to leave COVID behind us and return to “normal”, recent news reminds us that COVID remains a factor in markets, even if it is not at the market-meltdown magnitude of March 2020.
Despite high vaccination rates, surging COVID cases in Austria have led to another country wide lock down, while in Germany the surge in cases has resulted in targeted closures, but also the entire German yield curve returning to negative territory.
The prospect for slower growth, and thus reason for the ECB to remain ultra-accommodative, has put downward pressure on the Euro and upward pressure on the USD (thus potentially tightening global liquidity).
In the U.S., the prospect of lockdowns looks unlikely, but that does not mean the U.S. economy is indifferent to a rise in cases. A JPMorgan study highlighted by Bloomberg quantified the impact of a rise in cases on credit card spending: during the Delta variant wave, every time cases in a state doubled, card spending dropped by 2.5 percentage points in that state.
As COVID related stimulus wanes, watching the impact of potential future outbreaks on consumer appetite and ability to spend will be crucial.
Disclosures
IMPORTANT LEGAL INFORMATION
This material is for informational purposes only and is not intended to be an offer or solicitation to purchase or sell any security or to employ a specific investment strategy. It is intended solely for the information of those to whom it is distributed by Fieldpoint Private. No part of this material may be reproduced or retransmitted in any manner without prior written permission of Fieldpoint Private. Fieldpoint Private does not represent, warrant or guarantee that this material is accurate, complete or suitable for any purpose and it should not be used as the sole basis for investment decisions. The information used in preparing these materials may have been obtained from public sources. Fieldpoint Private assumes no responsibility for independent verification of such information and has relied on such information being complete and accurate in all material respects. Fieldpoint Private assumes no obligation to update or otherwise revise these materials. This material does not contain all of the information that a prospective investor may wish to consider and is not to be relied upon or used in substitution for the exercise of independent judgment. To the extent such information includes estimates and forecasts of future financial performance it may have been obtained from public or third-party sources. We have assumed that such estimates and forecasts have been reasonably prepared on bases reflecting the best currently available estimates and judgments of such sources or represent reasonable estimates. Any pricing or valuation of securities or other assets contained in this material is as of the date provided, as prices fluctuate on a daily basis. Past performance is not a guarantee of future results. Fieldpoint Private does not provide legal or tax advice. Nothing contained herein should be construed as tax, accounting or legal advice. Prior to investing you should consult your accounting, tax, and legal advisors to understand the implications of such an investment.
Fieldpoint Private Securities, LLC is a wholly-owned subsidiary of Fieldpoint Private Bank & Trust (the “Bank”). Wealth management, securities brokerage and investment advisory services offered by Fieldpoint Private Securities, LLC and/or any non-deposit investment products that ultimately may be acquired as a result of the Bank’s investment advisory services:
Such services are not deposits or other obligations of the Bank:

− Are not insured or guaranteed by the FDIC, any agency of the US or the Bank
− Are not a condition to the provision or term of any banking service or activity
− May be purchased from any agent or company and the member’s choice will not affect current or future credit decisions, and
− Involve investment risk, including possible loss of principal or loss of value.
© 2021 Fieldpoint Private
Banking Services: Fieldpoint Private Bank & Trust. Member FDIC.
Registered Investment Advisor: Fieldpoint Private Securities, LLC is an SEC Registered Investment Advisor and Broker Dealer. Member FINRA, MSRB and SIPC.
Cameron Dawson
CFA®,
Chief Market
Strategist