
In Focus: The U.S. Housing Market Outlook for 2022 – An Economic Cornerstone

The U.S. housing market is the cornerstone of economic growth and prosperity. With total housing spending contributing over 15% to annual GDP since the mid 1980’s (Chart 1), the market is a key contributor to economic output, household wealth, consumer spending, fixed investment, and employment.
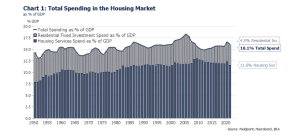
Reference note: “Residential fixed investment” captures housing expenditures related to new single and multi-family construction, residential remodeling, and brokers fees. “Housing services” captures renters’ rent and utilities, as well as homeowner’s imputed rent and utility payments.
In 2020, the introduction of mandated lock downs and social distancing, paired with soaring levels of initial jobless claims, produced an increasing level of uncertainty throughout housing forecasts. Despite fears of a major slowdown, strong demand persisted, resulting in a staggering 12% year over year increase in the national median sales price.
2021 housing forecasts were met with similar levels of skepticism, but again homebuyers spoke with clear force, setting 10 records throughout the year, including closing the year with an all-time record median sales price of $386,0002 (up 24.4% year over year) with over 60% of homes under contract within two weeks of hitting the market.
These robust statistics, paired with the anticipation of a more hawkish Fed, have led to a recent uptick in commentary regarding the sustainability of current market activity and growth in home prices, and whether market activity has caused a pricing bubble.
Tipping the Scales: Housing Supply & Demand Dynamics
In the early 2000’s, homebuyers were seemingly forcing themselves into the housing market on unstable footing. Demand was artificially inflated by loose underwriting standards, as consumers went into a buying frenzy with less than liquid balance sheets burdened by variable rate debt. As a result, demand proved to be short lived and sensitive to tighter liquidity.
In comparison, current household finances are much stronger and supportive of homeownership. As we discussed in our most recent “In Focus” piece, the biggest beneficiary of pandemic related assistance, provided by both the Fed and the Federal government, was the U.S. consumer. While households cleaned up their balance sheets with federal stimulus checks, and consumer net worth climbed in tandem with rising home values and financial assets, the financial health of the consumer was further supercharged by historic levels of accumulated excess savings.
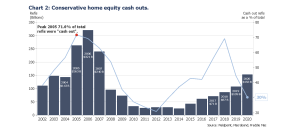
One source of this surge in savings was driven by the reduction of household leverage through mortgage refinancing. Per Freddie Mac’s recent refinancing report, in the first half of 2021, refinancing provided an average annual savings of $2,800, with 30% of borrowers shortening the term of their loan. And while home equity loans have increased recently, unlike the early 2000’s, existing homeowners were far more conservative with tapping into their home’s equity (Chart 2). This greater equity cushion will provide homeowners with flexibility, should they choose to sell their property.
While financial positions were strengthening during the pandemic, housing trends were changing as well. The pandemic created the need for more space, and as city dwellers left major metropolitan areas , rents collapsed throughout 2020. As household formation began to rebound in 2021, and people migrated back to the city, supply quickly dwindled leaving the national vacancy rate at lows last seen in the early 1980’s.
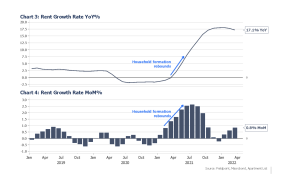
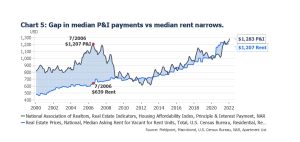
These underlying forces organically cultivated an above average increase in homebuying activity. Demand proved to be relatively inelastic as the alternative (rent) saw record inflation (Charts 3 & 4), which significantly narrowed the gap in median rent relative to median mortgage payments, making the case for buying a home more enticing (chart 5).
As the demand curve for housing shifted, the supply curve remained extremely constrained, with housing inventories at the lowest levels seen in over 20 years. As seen in Chart 6, robust demand further exacerbated the housing shortage throughout 2021, leaving monthly supply of homes at historic lows of less than 2 months (Chart 6).
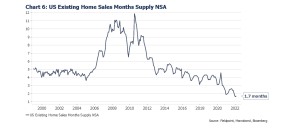
Reference note: “Month’s supply” of homes indicates how long the current for-sale inventory would last given the current sales rate. 6 months of supply represents and even split of buyers and sellers.
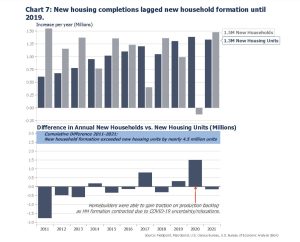
Unlike the early 2000’s, when new home completions were surging, recent residential construction has lagged household formation growth for almost a decade (Chart 7). Although the tight labor market and supply chain constraints have played a role in recent years, the main cause of the gap in housing supply and demand is similar to the current commodity shortage: following deep price downturns, investment was delayed, setting the stage for future shortages.
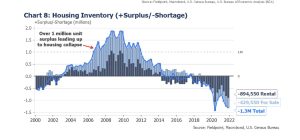
This severe imbalance of supply and demand has upheld record growth in home values (Chart 8). And over the next few years, we can expect the severity of this supply shortage to ease, as homebuilder productivity gains traction, and historic levels of demand are cooled, mostly as higher interest rates erode housing affordability. Throughout 2022, we can expect these conditions to cool red hot annual growth rates in home prices back to long term trend levels of 3-4%.
Hiking with the Fed: Affordability Implications
Despite rising housing prices, unwavering demand trends have found support through elevated affordability levels (Chart 9-see reference note). In comparison to the years leading up to the housing collapse, housing affordability levels have remained strong due to more stringent underwriting standards, and historically low interest rates.
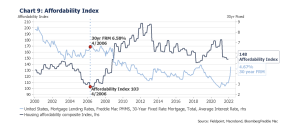
Reference note: The National Association of Realtors (NAR) Affordability Index compares median household income relative to a mortgage payment calculated using the national median home-sales price, assuming a 20% down payment, and Freddie Mac’s 30 year fixed mortgage contract rate, based on 30 year fixed mortgage points and fees current average 30 year rate.
An index measure of 100 indicates that the median income covers the median monthly mortgage payment.
Looking forward, two key variables for future housing affordability levels are interest rates and qualifying income. Below we review the outlook for each key factor.
1. Interest rates
With inflation proving to be more than just transitory, the Fed has elected to pull on the reins by normalizing its balance sheet and implementing a series of rate hikes throughout 2022.
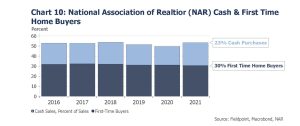
In response, we can expect higher interest rates to restrict demand to some degree, as it will increase all-in carrying costs (mortgage payments for new buyers and those with floating rates), as well as opportunity costs for those who have recently locked in favorable rates. However, if we consider rate hike impacts by each homebuyer segment, this assumption appears to be a fallacy of composition. For example, rate hikes will be nil for cash buyers, which have consistently made up about 20% of total home sales since 2015 (chart 10). Additionally, the impact of rising interest rates on affordability levels for existing homeowners will be marginally offset, as they will have more cash to put down on a home purchase through capital gains realized on home sales that have appreciated at double digits throughout 2020 and 2021. In contrast, first time homebuyers will feel the most pressure from rate hikes, as we can expect this buyer segment to be priced out of higher tiered markets that were once within reach, prior to rising interest rates.
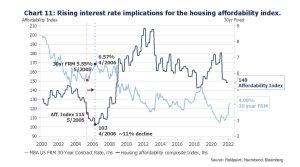
The Mortgage Banker Association currently has the most aggressive forecast for 30 year mortgage rates, estimating an average 30 year fixed rate mortgage (FRM) of 4.5% by the close of 2022 (about a 1% increase from the beginning of January). As shown in Chart 11, we saw a similar increase back in the second quarter of 2005, which deteriorated affordability levels by about 11%, from 115 to 103. Given current affordability levels, even a 20% deterioration would keep indexed affordability levels healthy at just under 120.
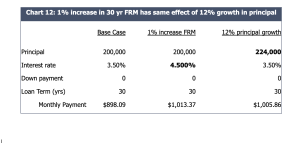
From the perspective of a monthly mortgage payment, as seen in Chart 12, a 1% increase in a 30 year fixed mortgage rate has roughly the same impact on a monthly mortgage payment as a 12% increase in notional principal, which equates to about a $110 increase in the monthly mortgage payment (per every $200,000 in principal). Considering the median sales price appreciated 24% in 2021, and demand trends remained intact, we expect a rising interest rate environment to gradually erode affordability and demand, and gradually reduce the annual growth rate in home prices to the long run average of 3-4%.
2. Mortgage qualifying income
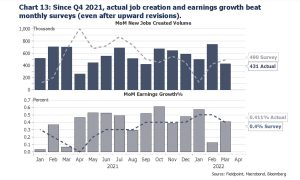
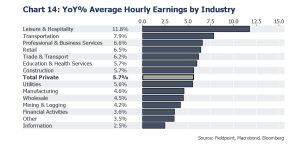
In contrast to the early 2000’s, the strength of the current labor market has provided reassuring growth in both wages and job creation-keeping unemployment rates at historic lows (Charts 13 & 14).
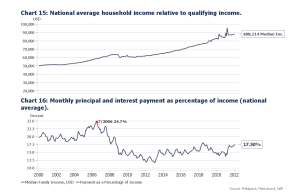
As seen in Charts 15 and 16, the gap in median household income and mortgage qualifying income remains quite strong. However, we can expect this gap to narrow as interest rates increase from historic lows.
The Illusion of Déjà Vu
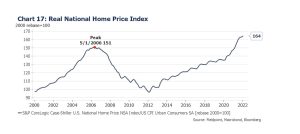
As seen in Chart 17, even after adjusting for inflation, housing prices have surged – surpassing previous peaks last seen in 2006. This, paired with recent record breaking statistics, has created a sense of déjà vu for some, as shown by a recent Redfin survey revealing that 77% of homebuyers and sellers believe that their market is experiencing a price bubble. However, if we put market fundamentals in focus, our opinion is that today’s housing market conditions are immensely different from those leading up to the 2007 collapse.
Below is a brief assessment of the current dynamics within the housing market, and why this market is far better positioned to withstand pressures from the more restrictive monetary policy.
1. It’s Only a Bubble if It’s Going to Pop.
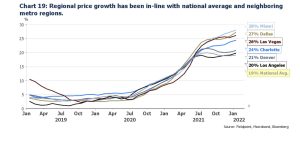
An economic bubble is characterized as an unsustainable surge in asset prices that strongly deviates from levels that underlying fundamentals can reasonably justify. When compared to the national average, the growth in housing prices on a regional level can provide valuable insight on the rationality of buyers and sellers.
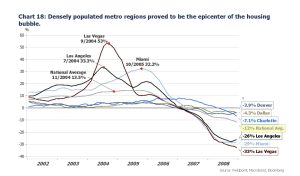
Chart 18 illustrates the annual growth trends leading up to the housing bubble. From the perspective of the national average, annual growth ranging from 10-15% was relatively within reason, considering key fundamentals such as low interest rates and easy access to credit. However, such fundamentals could not adequately explain the substantial deviations seen in densely populated metropolitan regions, such as Las Vegas, Miami, and Los Angeles. These inexplicable differences pointed to a possible period of “irrational exuberance” amongst speculative homebuyers in these hot spot areas, which proved to be the epicenter of unsustainable bubbles.
In comparison, recent trends have been more gradual in nature, with growth rates consistent across all regional areas, while remaining in line with the national average (chart 19). Furthermore, metro regions that previously experienced extreme boom-bust cycles have also remained below previous growth peaks, last seen in 2004-2005. This gradual above average increase in home prices, trending throughout all markets, reflects a true demand shift throughout all market tiers and regions and a nationwide housing shortage- as opposed to a buyer frenzy in hot spot areas fueled by loose credit and buyer optimism, as we saw in the early 2000’s.
2. More stringent and comprehensive underwriting standards this go around.
In the years leading up to the great financial crisis, it seemed as if all you needed was a pulse and a pen to qualify for a mortgage. As seen in Chart 20, since the 2007 housing collapse, underwriting has become more regulated, and the availability of mortgage credit has remained at secure levels.
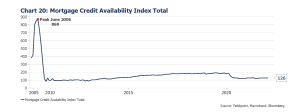
Reference note: The Mortgage Bankers Association’s Mortgage Credit Availability Index (MCAI) measures the quantity and quality of credit supplied to the market over time across different segments of the market. An increase (decrease) in the MCAI indicates that lending standards are loosening (tightening).
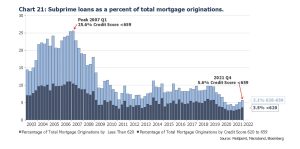
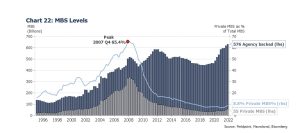
Additionally, the significant contributors of the great recession-high risk subprime mortgage lending and private mortgage backed securities-have remained in check (Charts 21 & 22). These prudent metrics will make recent home price gains more sustainable because they are not being driven by easy credit to high risk and speculative borrowers.
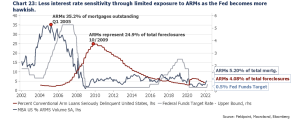
3. Homeowners are much less sensitive to interest rates.
Throughout the early 2000’s, adjustable rate mortgages (ARMs) were all the rage. This made borrowers more sensitive to interest rate risk, because even though initial payments were low, when the Fed raised interest rates for the first time in four years during the summer of 2004 and followed with sixteen consecutive hikes, mortgage payments soared with each ARM reset. This forced weaker homeowners into foreclosure and short-sales.
As seen in Chart 23, in comparison to the early 2000’s, homeowners have largely sheltered themselves from interest rate risk, with more than 95% of total mortgages outstanding issued as fixed rate products. This will prove to be a crucial pillar of support for home values by limiting default risk through this next rate hiking season.
Conclusion: Cooling off
In conclusion, housing market activity has been red hot for the past few years, with growth in home values supercharged by historically low interest rates paired with a significant imbalance of supply and demand.
As these contributors are diluted, through a more hawkish Fed and demand is normalized by reduced affordability levels, we can expect home value growth to cool throughout 2022 and return to their long term national average growth rate (3-4% YoY).
One key component to watch, will be the Fed’s ability to tame broad based inflation. As this has the potential to erode the strength of household financial positions, specifically accumulated savings levels-which could negatively impact household formation, and therefore the demand for housing.
IMPORTANT LEGAL INFORMATION
This material is for informational purposes only and is not intended to be an offer or solicitation to purchase or sell any security or to employ a specific investment strategy. It is intended solely for the information of those to whom it is distributed by Fieldpoint Private. No part of this material may be reproduced or retransmitted in any manner without prior written permission of Fieldpoint Private. Fieldpoint Private does not represent, warrant or guarantee that this material is accurate, complete or suitable for any purpose and it should not be used as the sole basis for investment decisions. The information used in preparing these materials may have been obtained from public sources. Fieldpoint Private assumes no responsibility for independent verification of such information and has relied on such information being complete and accurate in all material respects. Fieldpoint Private assumes no obligation to update or otherwise revise these materials. This material does not contain all of the information that a prospective investor may wish to consider and is not to be relied upon or used in substitution for the exercise of independent judgment. To the extent such information includes estimates and forecasts of future financial performance it may have been obtained from public or third-party sources. We have assumed that such estimates and forecasts have been reasonably prepared on bases reflecting the best currently available estimates and judgments of such sources or represent reasonable estimates. Any pricing or valuation of securities or other assets contained in this material is as of the date provided, as prices fluctuate on a daily basis. Past performance is not a guarantee of future results. Fieldpoint Private does not provide legal or tax advice. Nothing contained herein should be construed as tax, accounting or legal advice. Prior to investing you should consult your accounting, tax, and legal advisors to understand the implications of such an investment.
Fieldpoint Private Securities, LLC is a wholly-owned subsidiary of Fieldpoint Private Bank & Trust (the “Bank”). Wealth management, securities brokerage and investment advisory services offered by Fieldpoint Private Securities, LLC and/or any non-deposit investment products that ultimately may be acquired as a result of the Bank’s investment advisory services:
Such services are not deposits or other obligations of the Bank:

− Are not insured or guaranteed by the FDIC, any agency of the US or the Bank
− Are not a condition to the provision or term of any banking service or activity
− May be purchased from any agent or company and the member’s choice will not affect current or future credit decisions, and
− Involve investment risk, including possible loss of principal or loss of value.
© 2022 Fieldpoint Private
Banking Services: Fieldpoint Private Bank & Trust. Member FDIC.
Registered Investment Advisor: Fieldpoint Private Securities, LLC is an SEC Registered Investment Advisor and Broker Dealer. Member FINRA, MSRB and SIPC.
Amanda DiSanti
Investment
Strategy
Associate